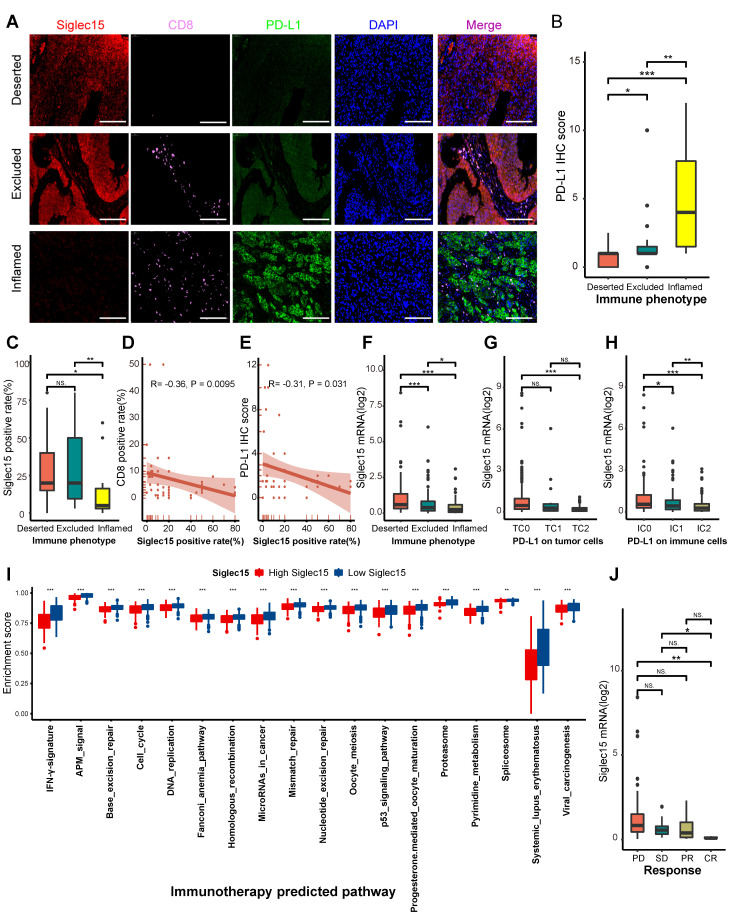
Figure 4.
Correlations between Siglec15, the immune phenotype, and the clinical response of immunotherapy in BLCA. (A) Expression of Siglec15, CD8 and PD-L1 in the bladder cancer microarray (TMA) cohort were detected using immunofluorescence. Representative co-staining images of Siglec15, PD-L1, and CD8 in three immune phenotypes. Bladder cancer tissues were divided into three immune phenotypes, namely deserted, excluded, and inflamed phenotypes, based on the spatial distribution of CD8+ T cells. The scale bars correspond to 200 μm. (B-C) PD-L1 IHC score and the positive rate of Siglec15 (detected using immunofluorescence) in the three phenotypes of the TMA cohort. (D) Correlation between the Siglec15 positive rate and CD8 positive rate detected using immunofluorescence. (E) Correlation between the Siglec15 positive rate (detected using immunofluorescence) and PD-L1 IHC score. (F) Expression of Siglec15 in all three phenotypes in the IMvigor210 cohort. (G-H) Differences in the PD-L1 expression on tumor cells, and the PD-L1 expression on immune cells between high- and low-Siglec15 groups in the IMvigor210 cohort. (I) Differences in the enrichment scores of immunotherapy-predicted pathways between high- and low-Siglec15 groups in TCGA-BLCA cohort. (J) Correlation between Siglec15 and the clinical response of cancer immunotherapy in the IMvigor210 cohort. The asterisks indicate a significant statistical p-value calculated using the Mann-Whitney U test (*P < 0.05; **P < 0.01; ***P < 0.001). IHC: immunohistochemistry; PD: progressed disease; SD: stable disease; PR: partial response; CR: complete response.

