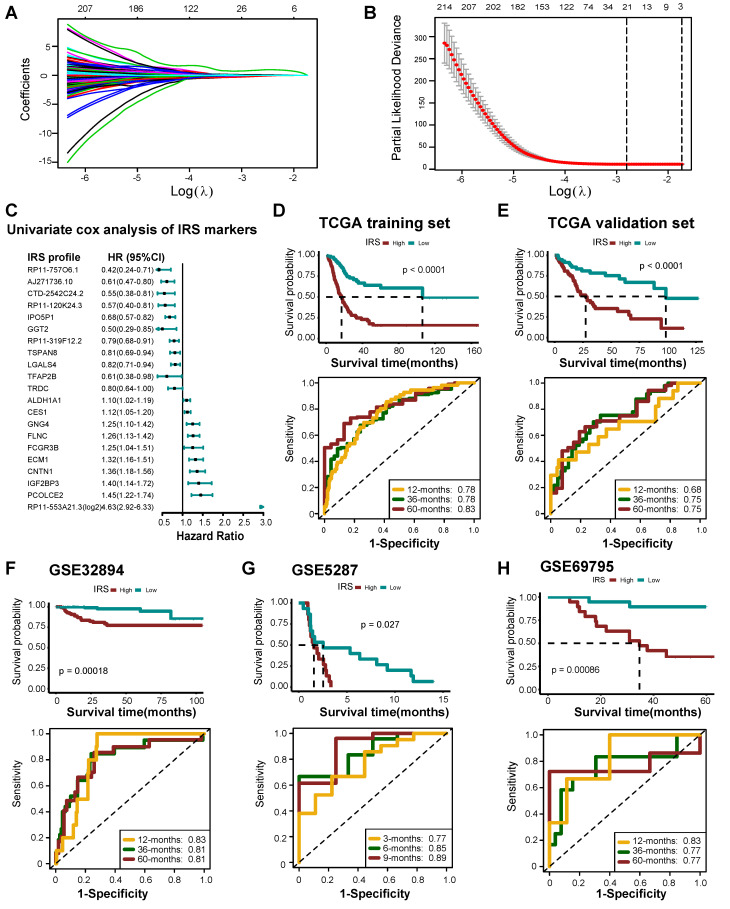
Figure 7.
Developing IRS RNA-expression profiles using LASSO Cox regression. (A) LASSO coefficient profiles of 524 prognostic RNAs in TCGA training cohort. The coefficient profile plot was developed against the log (Lambda) sequence. (B) Cross-validation for turning parameter selection via minimum criteria in the LASSO regression model. Two dotted vertical lines were plotted at the optimal values using the minimum criteria. Optimal RNAs with the best discriminative capability (21 in number) were selected for developing the IRS. (C) Forest plot of the IRS RNA-expression profiles in univariate cox analysis. (D) Development of IRS in TCGA training set and the predictive accuracy of IRS for survival. (E) Validation of the IRS in TCGA validation set. (F-H) Validation of the IRS RNA-expression profiles in three external independent sets: GSE32894, GSE5287, and GSE69795.

