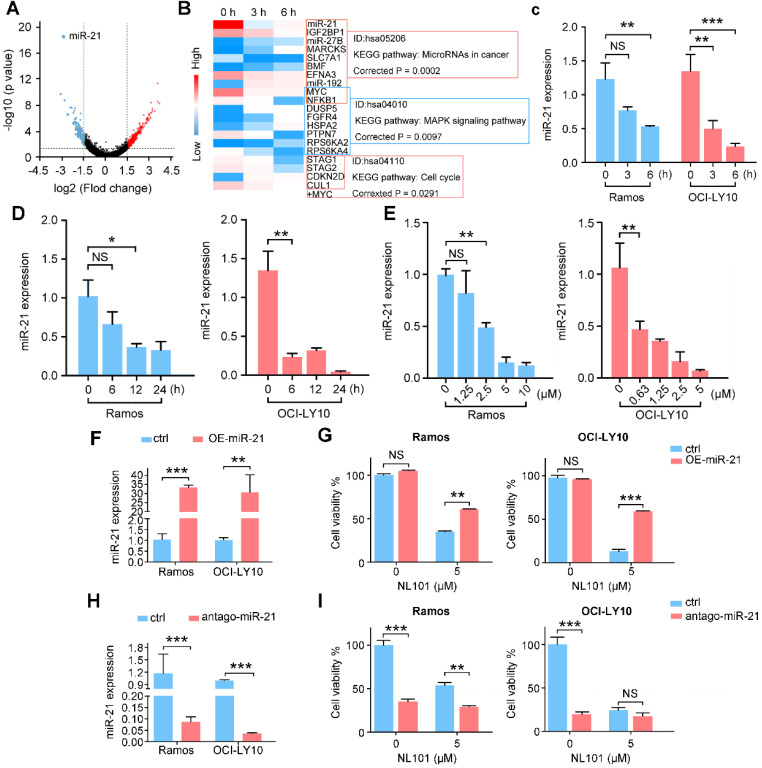
Figure 3.
NL101 inhibits miR-21 expression. A. The volcano plot was used for enabling visualization of the relationship between fold change (FC) and statistical significance. The vertical lines correspond to 1.5-log FC in up and down expression, while the horizontal line represents a p-value of 0.05. Therefore, the black point in the plot represents genes with no statistical differences (-1.5 < log FC < 1.5, P > 0.05), the red point represents upregulated genes (log FC > 1.5, P < 0.05) and the blue point represents downregulated genes (log FC < -1.5, P < 0.05) with statistical significance. B. Heatmap analysis showed the hierarchical clustering of differentially-expressed genes in OCI-LY10 cells receiving 10 µM NL101 for 0, 3, 6 h. C. Ramos and OCI-LY10 cells were treated with 10 µM NL101 for 0, 3, 6 h, miR-21 level was determined by qPCR. D. Ramos and OCI-LY10 cells were treated with 5 µM NL101 for 0, 6, 12 and 24 h, miR-21 level was determined by qPCR. E. Ramos and OCI-LY10 cells were treated with NL101 at indicated concentration for 12 h, miR-21 level was determined by qPCR. F. Ramos and OCI-LY10 were transfected with 10 nM pLL3.7-control-miR or pLL3.7-miR-21. Two days after transfection, miR-21 level was determined by qPCR. G. Ramos and OCI-LY10 were transfected with 10 nM pLL3.7-control-miR or pLL3.7-miR-21 for 2 days, then untreated or treated with 5 µM NL101 for 24 h, and cells were counted. H. Ramos and OCI-LY10 were transfected with 100 nM antago-control miR or antago-miR-21. Two days after transfection, miR-21 level was determined by qPCR. I. Ramos and OCI-LY10 were transfected with 10 nM control antago-miR or antago-miR-21 for 2 days, and then untreated or treated with 5 µM NL101 for 24 h, cells were counted. *, P < 0.05; **, P < 0.01; ***, P < 0.001; ctrl, control group.

