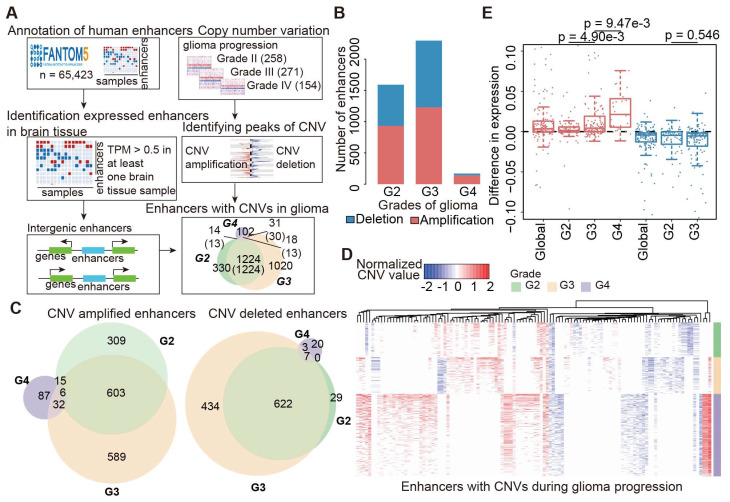
Figure 1.
Widespread CNAs of enhancers during glioma progression. (A) Flowchart showing identification of enhancers with CNAs in different grades of glioma patients. (B) Numbers of enhancers with CNAs in G2, G3 and G4 glioma patients. Red for enhancers with copy number amplification, and blue for enhancers with copy number deletion. (C) Venn plots showing the overlap of enhancers with CNVs in G2, G3 and G4. (D) Heat map showing the normalized CNVs of enhancers during glioma progression. (E) Boxplots showing the differences of enhancer expression between amplified/deleted and other glioma patients.

