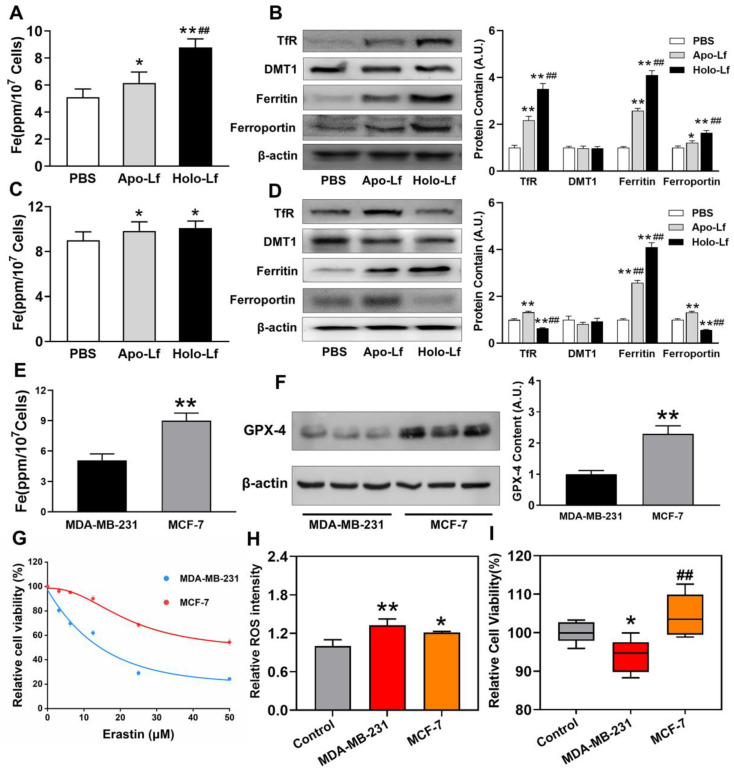
Figure 6.
Different iron homeostatic regulation and redox balance capacity between MDA-MB-231 and MCF-7 cells: (A-D) Intracellular iron measurement and Western blot analysis of TfR, ferritin, and ferroportin of MDA-MB-231 (A-B) and MCF-7 (C-D) cells incubated with PBS, Apo-Lf, and Holo-Lf (400 μg/mL) (n = 3). *Compared with PBS group P < 0.05. **Compared with PBS group P < 0.01. ##Compared with Apo-Lf group P < 0.01. (E) Total iron content of MDA-MB-231 and MCF-7 cells. (F) Western blot analysis of GPX-4 in MDA-MB-231 and MCF-7 cells (n = 3). **Compared with MDA-MB-231 cells P < 0.01. (G) Relative cell viability of MDA-MB-231 and MCF-7 cells incubated with various concentrations of erastin (n = 6). (H-I) Relative ROS (n = 3) and cell viability (n = 6) of MDA-MB-231 and MCF-7 cells incubated with FeCl3. *Compared with control group P < 0.05. **Compared with control group P < 0.01. ##Compared with MDA-MB-231 cells P < 0.01. Total grey intensity of each protein was normalized to the grey intensity of an appropriate protein in cells treated with PBS or MDA-MB-231 cells. Data are shown as mean±SD.

