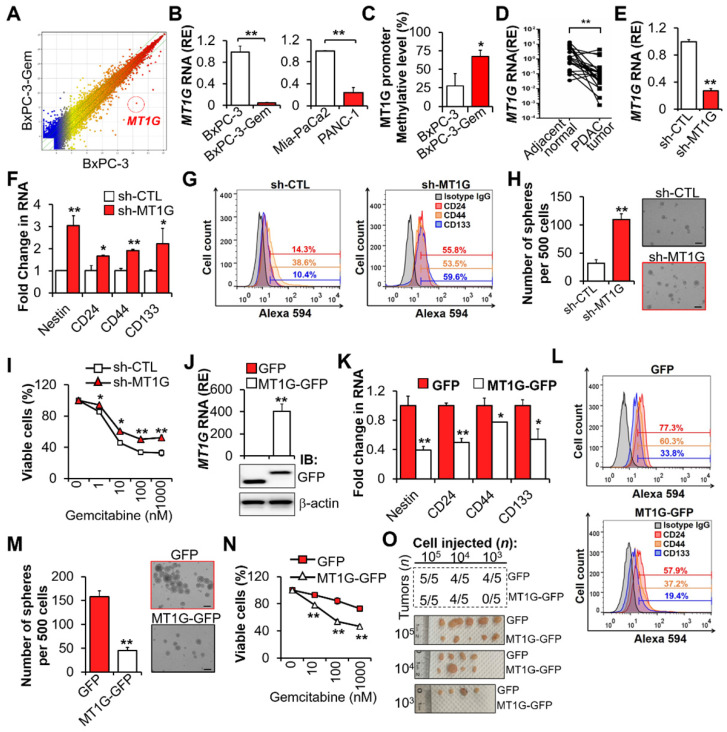
Figure 1.
Downregulation of MT1G in gemcitabine resistant PDAC cells confers to cancer stemness features. (A) Scatterplot shows log intensities of global gene expression in BxPC-3 cells (x axis) against BxPC-3-Gem cells (y axis). The dot representing MT1G is shown. (B) RT-qPCR analysis of MT1G in indicated PDAC cells. (C) BSP analysis of the methylation status of MT1G promoter in BxPC-3 and BxPC-3-Gem cells. The percentage of methylation in each cell line is shown (n = 4). (D) RT-qPCR analysis of MT1G in PDAC and adjacent normal tissues (n = 21). (E-I) BxPC-3 cells were knocked down by shRNA, followed by RT-qPCR analysis (E, F), FACS analysis (G), sphere formation assay (H) and MTT assay post treatment with gemcitabine for 72 hours (I). Average number of spheres (H, left) and representative images (H, right) are shown. (J-N) RT-qPCR (J, up) and IB (J, bottom) analysis in MT1G overexpressing (MT1G-GFP) and control (GFP) BxPC-3-Gem cells. Expression of CSC markers (K, L), average number of spheres (M, left) and representative images (M, right), and relative cell viability after treatment with gemcitabine for 72 hours (N) were determined as described in E-I. (O) Summary table of in vivo tumor development in nude mice subcutaneously xenografted with a series of diluted MT1G overexpressing (MT1G-GFP) and control (GFP) BxPC-3-Gem cells (upper). Representative images of tumors formed (bottom) are shown. Data are presented as mean ± SD (n = 3). RE, relative expression. *P < 0.05, **P < 0.01 by two-tailed Student's t test.

