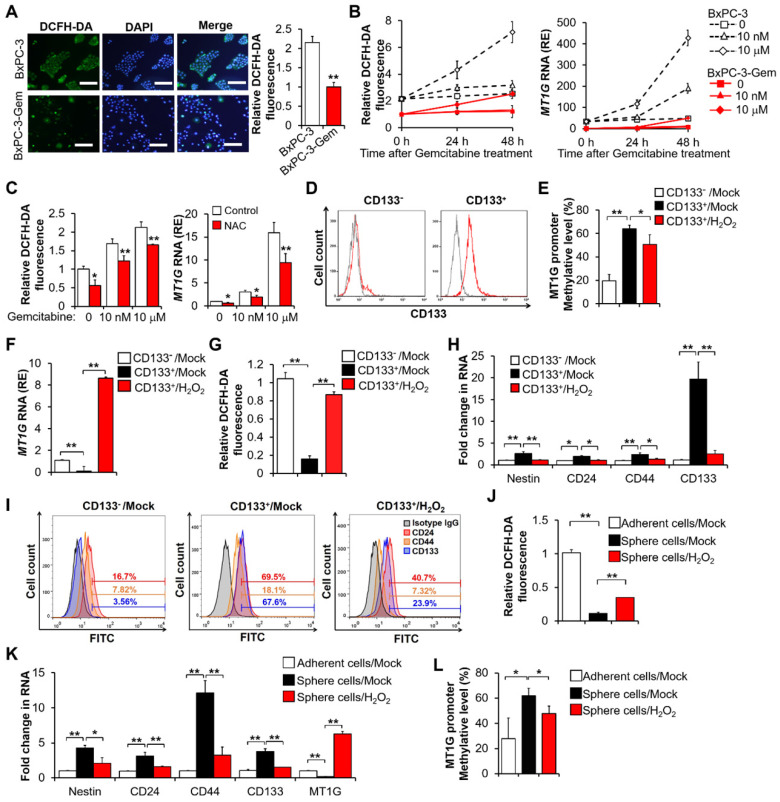
Figure 2.
Pancreatic CSCs exhibit hypermethylation of MT1G promoter. (A) ROS levels were evaluated using DCFH-DA staining by fluorescence microscopy (left) and flow cytometry (right) in BxPC-3 and BxPC-3-Gem cells. Bar, 100 μm. (B, C) Relative ROS levels (B, C left) and MT1G expression (B, C right) were evaluated by flow cytometry using DCFH-DA and RT-qPCR in BxPC-3 and BxPC-3-Gem cells treated with indicated concentrations of gemcitabine for up to 48 hours (B) or BxPC-3 cells treated with NAC (5 mM) for 1 hour prior to gemcitabine treatment for 48 hours (C). (D) Representative flow-cytometry histograms of CD133 (red) and its respective isotype controls (gray) in separated CD133- and CD133+ BxPC-3 cells subpopulation. (E-I) Separated CD133+ cells were treated with or without H2O2 (20 μM) for 72 hours, methylation status of MT1G promoter (E), mRNA expression of MT1G (F), relative ROS levels (G), and expression of CSC markers (H, I) were evaluated by BSP methylation analysis (E), RT-qPCR (F, H), flow cytometry using DCFH-DA (G) or indicated antibodies for CSC markers (I). (J-L) Four-weeks sphere cultured BxPC-3 cells were treated with or without H2O2 (20 μM) for 72 hours, and relative ROS levels (J), mRNA expression of CSC markers and MT1G (K), methylation status of MT1G promoter (L) were evaluated as described in E-I. Data are presented as mean ± SD (n = 3). RE, relative expression. *P < 0.05, **P < 0.01 by two-tailed Student's t test.

