Figure 3.
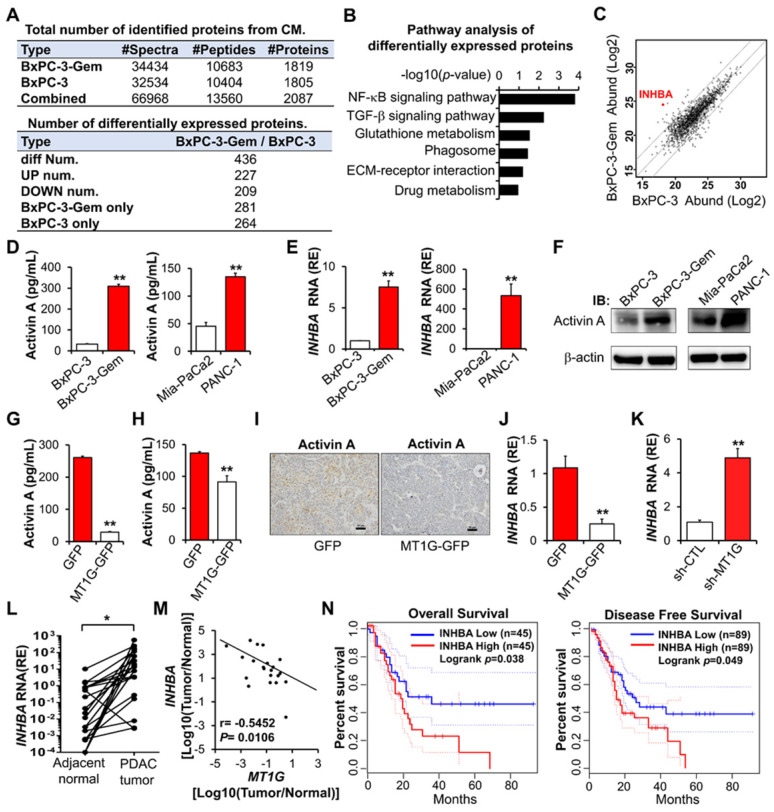
Activin A is a downstream target of MT1G. (A) Summary tables of secretome analysis results. (B) KEGG pathway analysis of differentially expressed proteins identified in BxPC-3 and BxPC-3-Gem CM. (C) Scatter plot of log intensities of secretome protein abundances between BxPC-3 cells (x axis) and BxPC-3-Gem cells (y axis). The dot representing INHBA is shown. (D-F) Secreted or cellular activin A protein levels and INHBA mRNA levels in pancreatic cancer cells were measured by ELISA (D), RT-qPCR (E) and IB (F). (G, H) ELISA analysis of secreted activin A protein levels in MT1G-overexpressing BxPC-3-Gem (G) and PANC-1 (H) cells. (I) Representative IHC images of activin A staining in the subcutaneous tumors from MT1G overexpressing (MT1G-GFP) and control (GFP) BxPC-3-Gem cells. Scale bar, 50 µm. (J, K) RT-qPCR analysis of INHBA mRNA levels in MT1G overexpressing BxPC-3-Gem cells (J) and MT1G knockdown BxPC-3 cells (K). (L) RT-qPCR analysis of INHBA mRNA expression in tumor and adjacent normal tissues of PDAC patients (n = 21). (M) Pearson's correlation analysis of MT1G and INHBA mRNA expression ratio (tumor/normal) from PDAC patients (n = 21). Pearson's correlation coefficient (r) and p-values are shown. (N) Kaplan-Meier curve of overall survival (left) and disease-free survival (right) of PDAC patients analyzed by using GEPIA. Blue curve represents patients with low expression of INHBA, red curve represents patients with high expression of INHBA. RE, relative expression. Data in (D, E, G, H, J, K) are presented as mean ± SD (n = 3), *P < 0.05, **P < 0.01 by two-tailed Student's t test.

