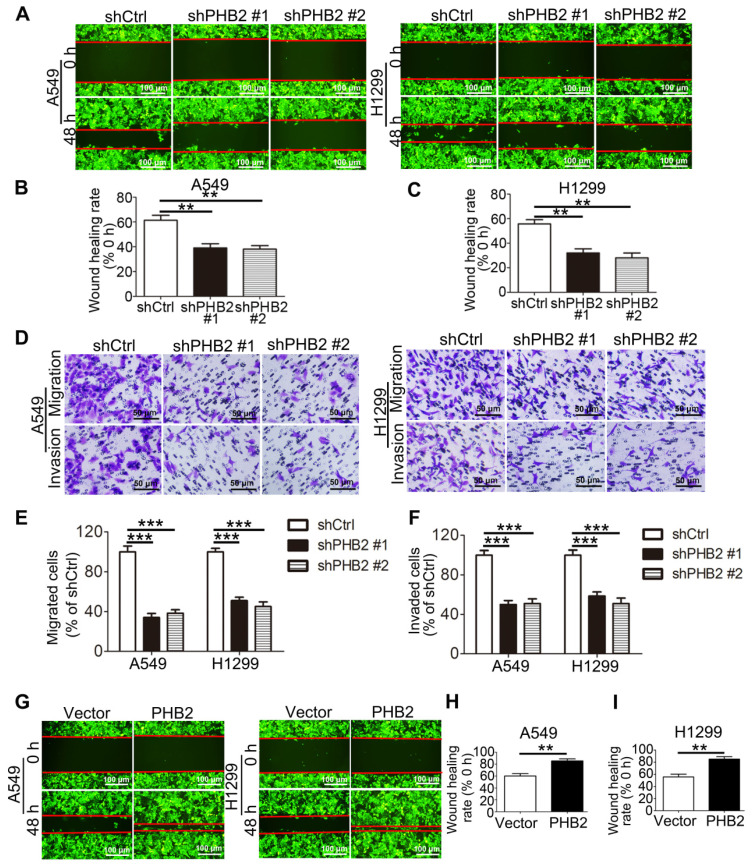
Figure 4.
Effects of PHB2 knockdown and overexpression on migration and invasion of NSCLC cells. (A)-(C) Representative wound healing photomicrographs and quantitative analysis of wound healing rates at 0 and 48 h of NSCLC cells with stable PHB2 knockdown. (D)-(F) Representative images and quantitative analysis of stained migrated or invaded NSCLC cells with stable PHB2 knockdown. (G)-(I) Representative wound healing photomicrographs and quantitative analysis of wound healing rates at 0 and 48 h of NSCLC cells with stable PHB2 overexpression. These tests were repeated three times independently. Data are presented as mean ± SEM. **P < 0.01; ***P < 0.001.

