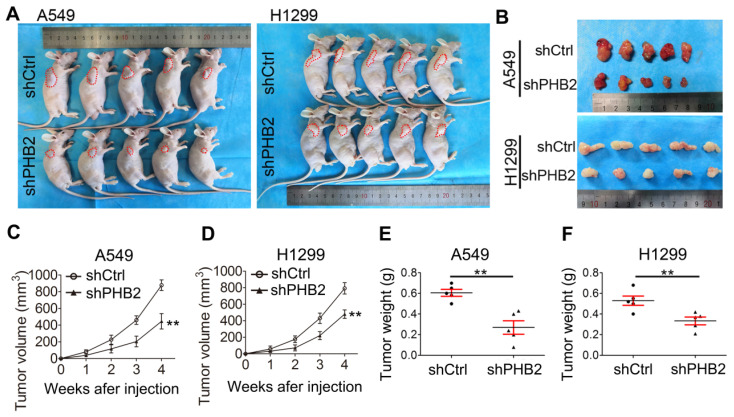
Figure 5.
Effects of PHB2 knockdown on tumorigenesis in vivo. (A)-(B) Images showing the morphology of NSCLC cell-derived tumor xenografts in each group. (C)-(D) Tumor growth curves showing the growth of PHB2 knockdown and control xenografts in vivo. (E)-(F) Tumor weight of PHB2 knockdown and control xenografts. Data are presented as mean ± SEM. **P < 0.01.

