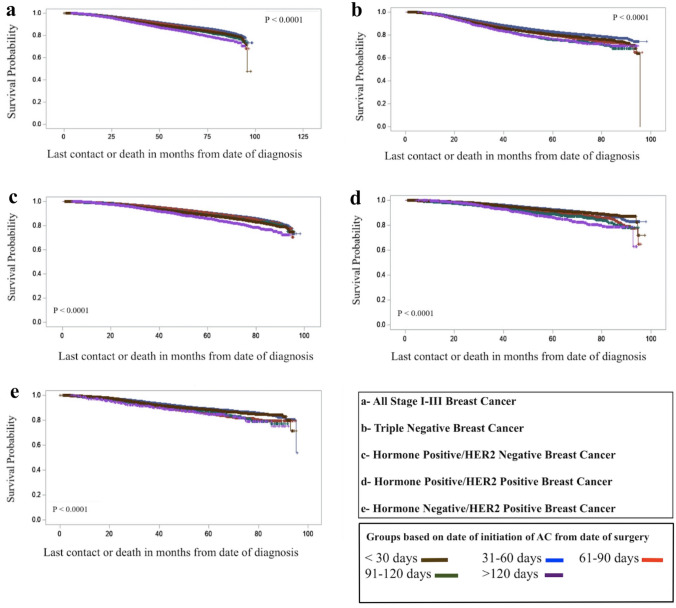
Fig. 2.
Kaplan–Meier survival curves at different points of time in months of the various groups and subgroups in the study. a All Stage I–III breast cancer patients. b Triple negative breast cancer patients. c Hormone positive/HER2 negative breast cancer patients. d Hormone positive/HER2 positive breast cancer patients. e Hormone negative/HER2 positive breast cancer patients

