. 2021 Jan 31;36(3):2135–2159. doi: 10.1007/s00180-021-01069-4
© The Author(s), under exclusive licence to Springer-Verlag GmbH, DE part of Springer Nature 2021
This article is made available via the PMC Open Access Subset for unrestricted research re-use and secondary analysis in any form or by any means with acknowledgement of the original source. These permissions are granted for the duration of the World Health Organization (WHO) declaration of COVID-19 as a global pandemic.
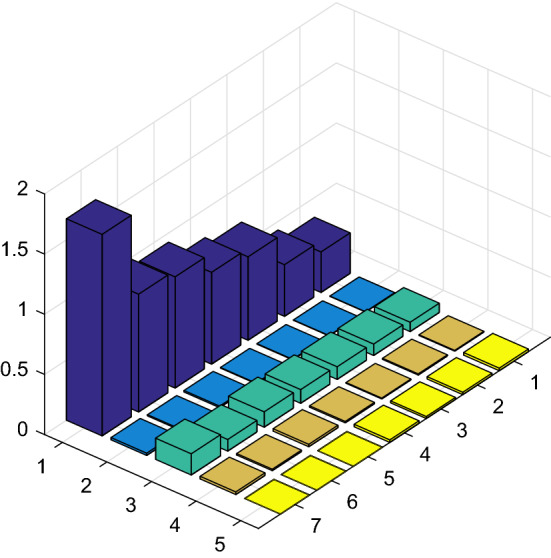
Fig. 2.

A bar graph of for seven income brackets
