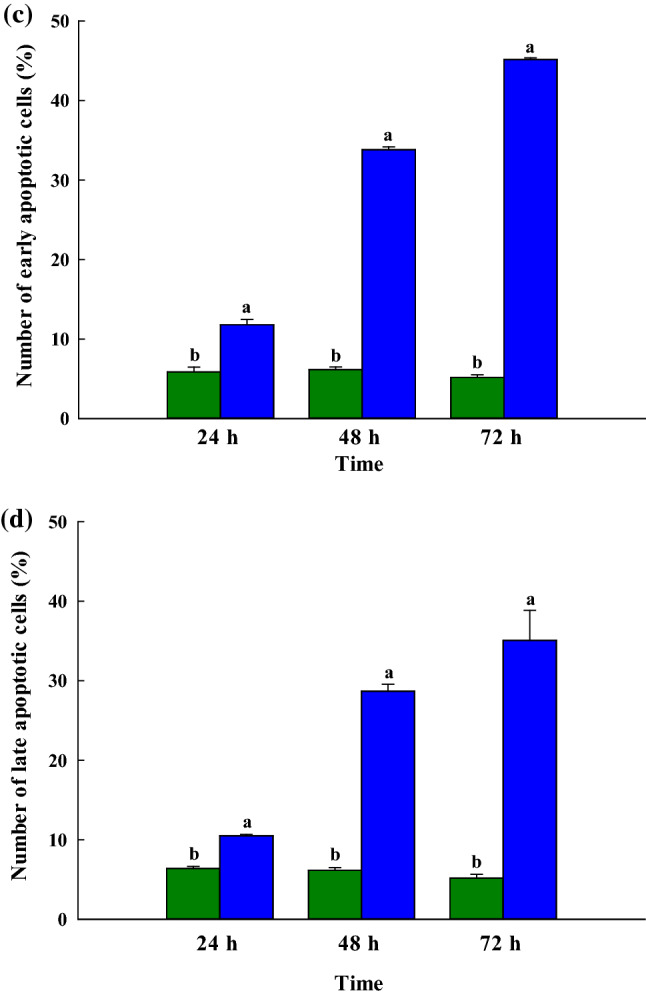
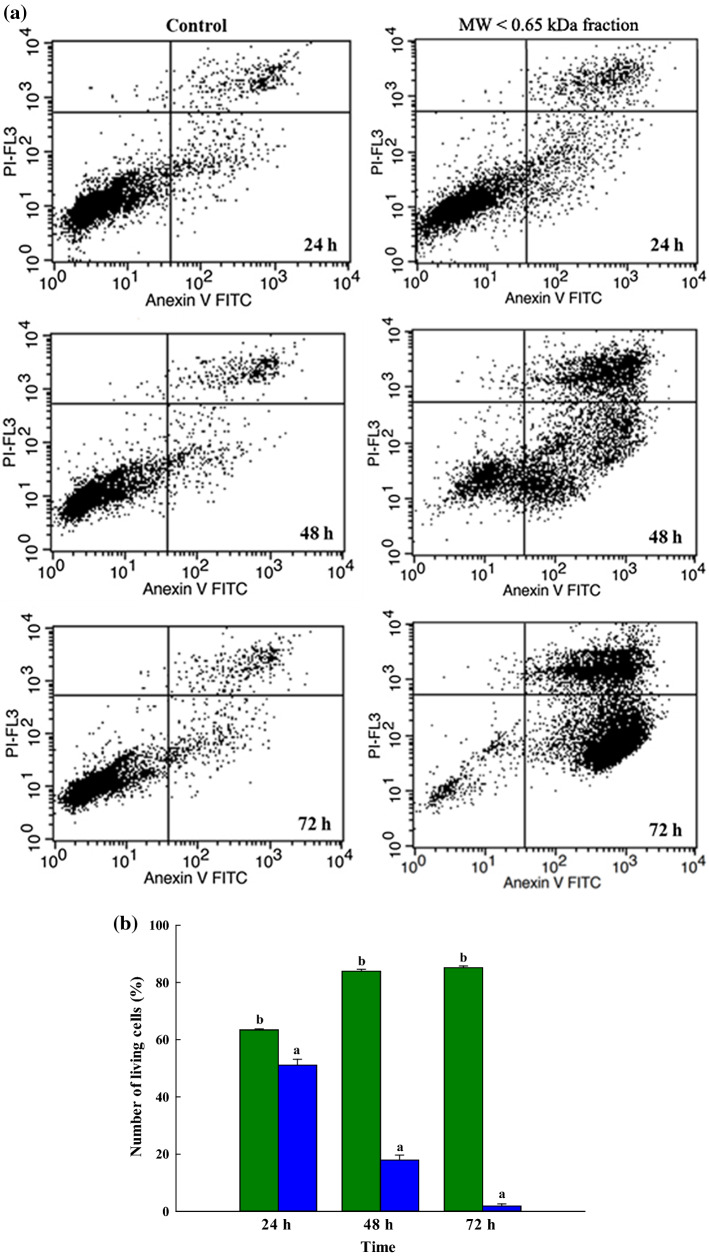
Fig. 2.

a Depiction of the Annexin V/PI double-staining assay of the ChaGo-K1 cells. Y indicates the PI-labeled population while X presents the FITC-labeled Annexin V positive cells. Presentation of the percentage of ChaGo-K1 cells categorized as b normal live cells, c early apoptotic cells, and d late apoptotic cells after 24 h, 48 h, or 72 h of treatment ([green color] control; [blue color] the MW < 0.65 kDa fraction). The findings are shown in the form of mean ± sem (n = 3). The various letters in superscript a, b show those items with statistically significant differences from each other (p > 0.05) (color figure online)

