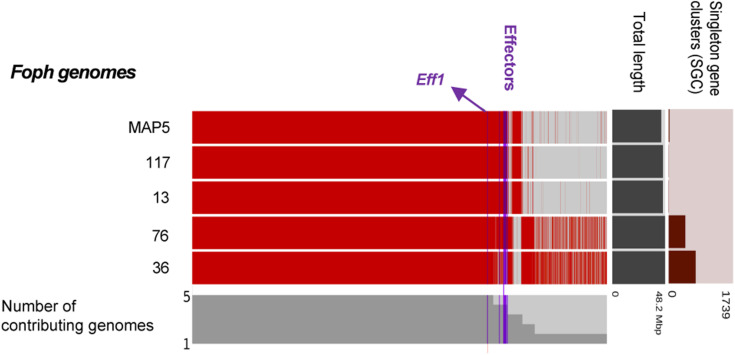
FIGURE 2.
Comparative genomic analysis of Foph isolates. The comparative genomic analysis of four pathogenic strains, Foph_MAP5, Foph_13, Foph_72, and Foph_117, and one non-pathogenic strain, Foph 36, was conducted to establish the possible lineage-specific regions based on the patterns of gene sharing. The cluster of shared and unique genes are shown by the red lines. Gene clusters are organized by their presence in all five genomes to those present in only one genome, indicated by the gray bars. The horizontal bar graphs to the right represent the total length of the genome and the number of singleton gene clusters for each genome. Blue vertical lines show the location of the SIX effectors as well as the putative novel effectors. The majority of putative and known effectors are only present in the gnomes of pathogenic strains, while effector Eff1 is present in all Foph genome assemblies, including the non-pathogenic Foph_36.

