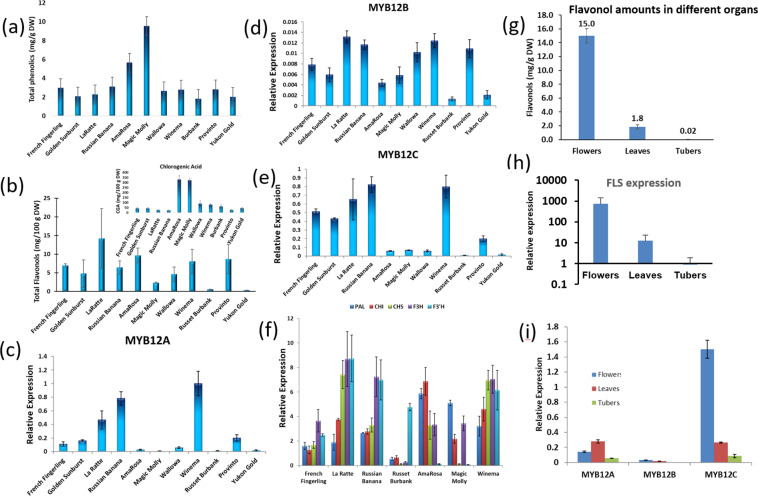
Fig. 4. Phenylpropanoids and gene expression in different cultivars.
Total phenolics (a) and total flavonols (b) in different genotypes. Chlorogenic acid amounts are shown in the inset. Relative expression of c MYB12A, d 12B, and e 12C in potatoes of varying flesh-color. f PAL and early flavonoid pathway gene expression. g Flavonol amounts in flowers, leaves or tubers; h FLS expression level in flowers, leaves and tubers; i Expression analysis of Myb12 A, B, and C in different organs. The data represents the means ± standard deviation of three biological replicates

