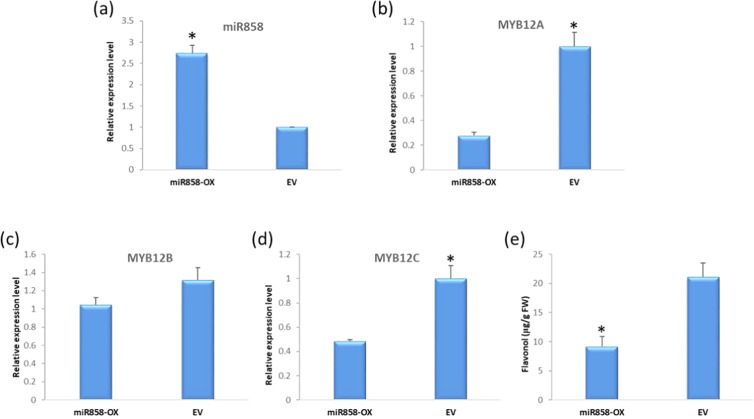
Fig. 6. Infiltration of miR858 into potato leaves.
a Expression level of mature miR858 after infiltration with the overexpressing construct or empty vector. b–d represent the expression level of MYB12A, B, and C in miR858 and empty pORE-O2 vector infiltrated leaves respectively. e Flavonol content in potato leaves after infiltration with and without overexpression of miR858. The data represents the means ± SD (n = 3). Asterisks indicates significant difference (p < 0.05)

