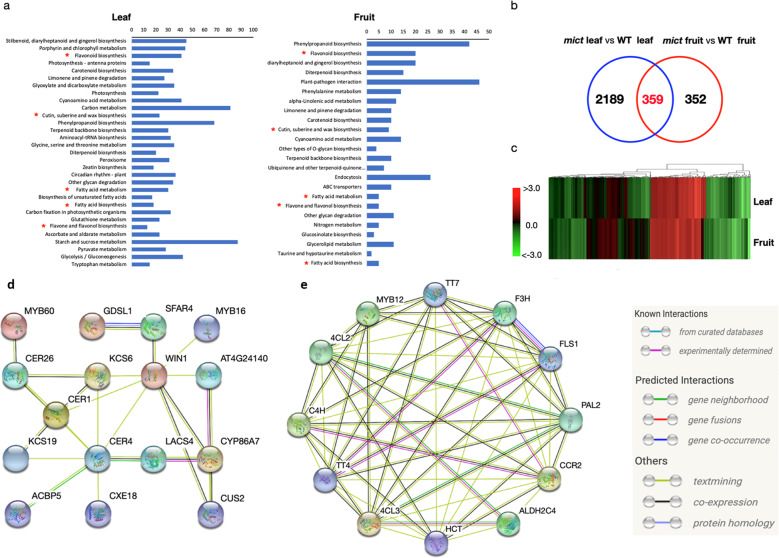
Fig. 3. Transcriptome analyses of cucumber leaf and fruit.
a KEGG pathways that were significantly enriched (Student’s t-test P < 0.01) in the differentially expressed genes (DEGs) in the leaf or fruit in the mict mutant. b Venn diagrams of DEGs in the leaves (blue) and fruits (red) in the mict mutant. c Fold changes of DEGs in the leaf or fruit in the mict mutant. A positive number indicates that the gene expression level is upregulated and a negative number indicates that the gene expression level is downregulated. d Homologs that were associated with cuticle component biosynthesis. e Homologs that were associated with flavonoid biosynthesis. The links between proteins in (d) and (e) signify the various interaction data supporting the network and are colored by evidence type in the right inset

