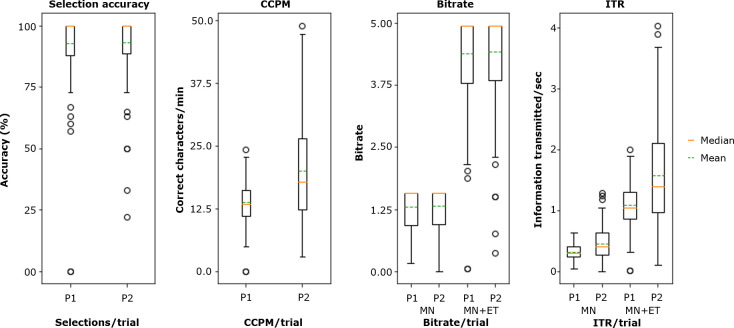
Figure 4.
System control performance metrics. Boxplots depict the system control performance of participant 1 (P1) and participant 2 (P2). Plots show the mean, median, interquartile range (IQR) and outliers (>±1.5*IQR) per specified performance metric calculated per trial during the typing tasks. Click selection accuracy measures the proportion of correct selections compared to the total selections made. Correct characters per minute (CCPM) measures the typing speed, correcting for errors. Bitrate measures bits transmitted per trial, irrespective of the time taken to make the selection. Information transfer rate (ITR) measures the rate of bits transferred per selection. Bitrate and ITR were calculated for the motor neuroprosthesis + eye-tracking (MN +ET) and motor neuroprosthesis alone (MN).

