
Figure 1.
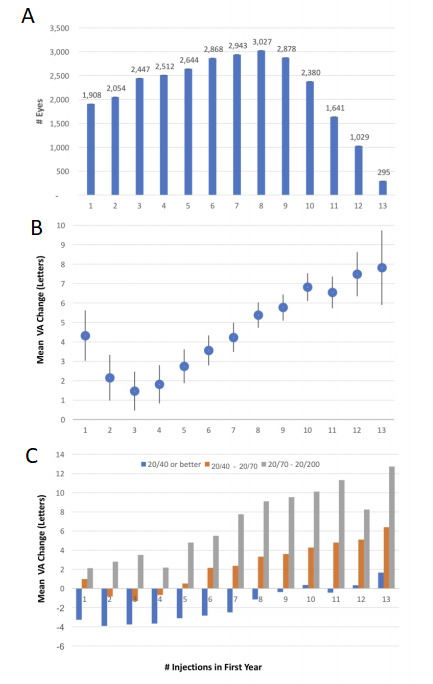
(A) Histogram showing the distribution of diabetic macular oedema (DMO) patient eyes stratified by number of antivascular endothelial growth factor (anti-VEGF) injections received in the first year of treatment. The median number of injections/eye in the first year of treatment was 6. The distribution is skewed towards the lower range, with 50% of patient eyes receiving ≤6 injections and <20% of patient eyes receiving 10–13 injections, representing monthly treatment. (B) Graph showing change in visual acuity (VA) versus anti-VEGF injections administered to all DMO patient eyes in the first year of treatment. The 95% CIs are included. At 1 year, mean letters gained showed a linear relationship with number of anti-VEGF injections, beyond 2 injections. (C) Graph showing the mean VA change over 1 year, stratified by both anti-VEGF injection frequency and baseline VA. Mean 1-year VA change tended to increase in patient eyes with both increased anti-VEGF injection frequency and decreased baseline VA. There were ceiling effects related to baseline VA. Patient eyes with baseline VA of 20/40 or better generally were at risk of VA loss at 1 year, except for those who received ≥10 injections. However, these patient eyes also showed better final VA compared with those starting with worse baseline VA.