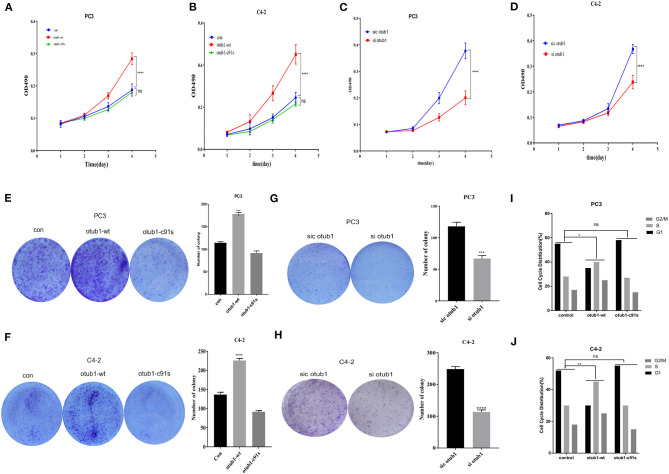
Figure 3.
Effects of increased OTUB1 expression on the cells cycle distribution of PC3 and C4-2 cells. (A,B) MTT assays in PC3 and C4-2 cells transfected with otub1 overexpression and otub1 c91s. (C,D) MTT assays in PC3 and C4-2 cells transfected with OTUB1 siRNA. (E,F) Colony formation assays in PC3 and C4-2 cells transfected with OTUB1 overexpression and otub1 c91s. (G,H) Colony formation assays in PC3 an C4-2 cells transfected with OTUB1 siRNA. (I,J) Effects of increased otub1 expression on the cell cycle distribution of PC3 (X2 = 12.59; P = 0.0135) and C4-2 (X2 = 15.17; P = 0.0044) cells. *P < 0.05; **P < 0.01; ***P < 0.001; ****P < 0.0001.

