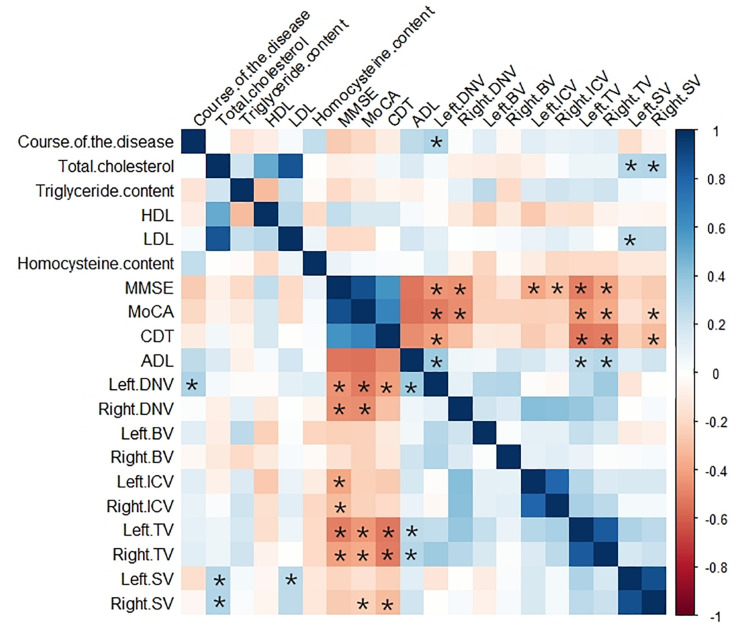
FIGURE 3.
Heat map showing the correlation analysis between MSV of cerebral veins and clinical data, laboratory examination indexes, MMSE score, MoCA score, CDT score, ADL score in AD group. Color bar on the right side displays the value of the correlation coefficient (higher from –1 to 1, and from red to blue). *Significant correlation.

