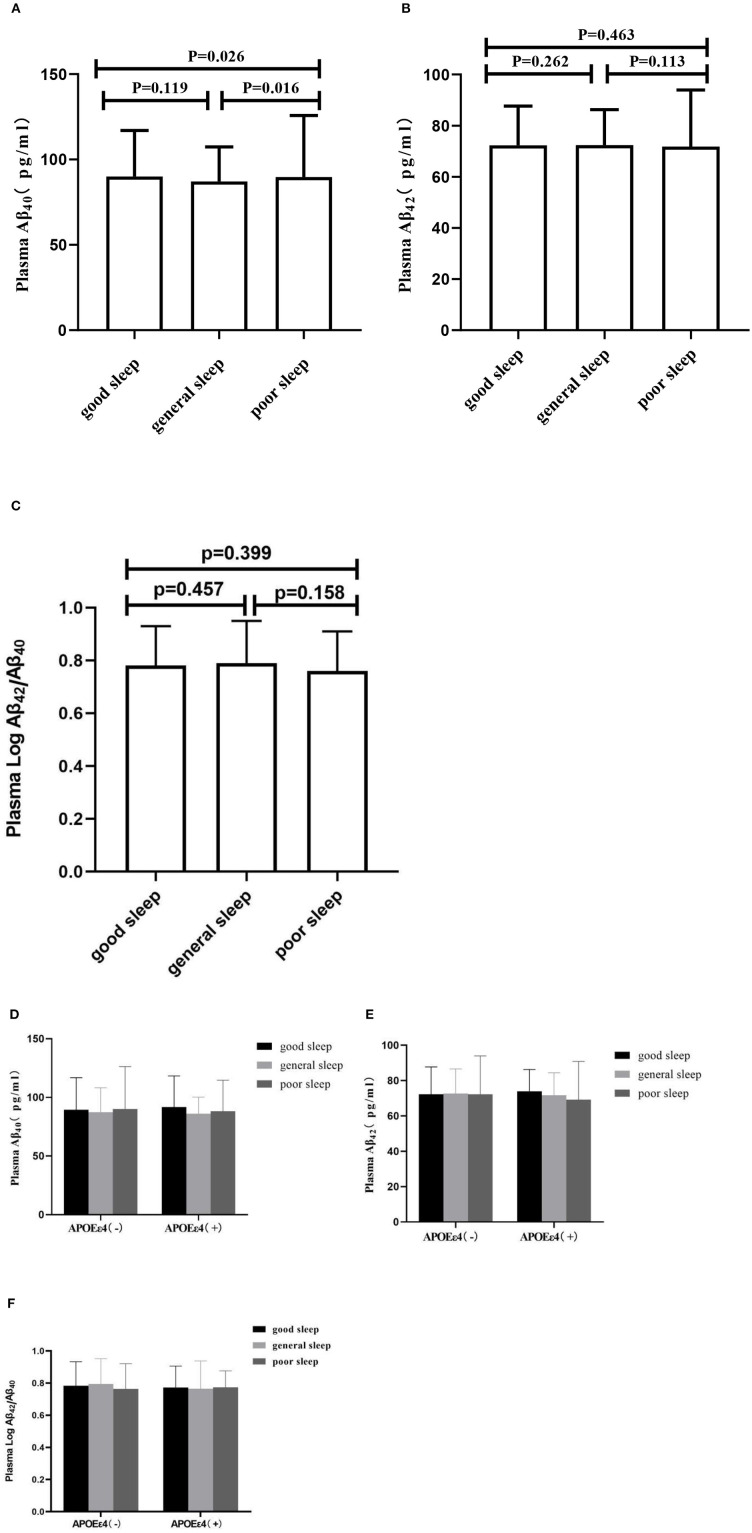
Figure 2.
Plasma concentrations of Aβ40, Aβ42, and Aβ42/Aβ40. In (A–C), the segments indicate the comparison between three sleep groups in total population. In (D–F), the segments indicate the comparison in subgroups according ApoEε4 status. Aβ40, Aβ42, and Aβ42/Aβ40 matched the normal distribution after the log-transformed, the data are shown as median (interquartile range), indicated by dots and connecting lines.

