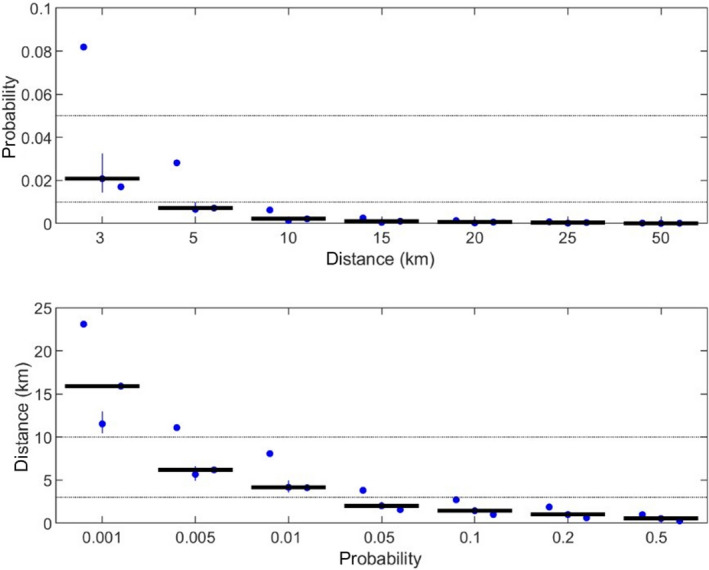
Figure 6.

Assessment of the radius of the protection and surveillance zone for African swine fever virus assuming the same transmission kernels as for CSF. The top panel shows the probability of transmission beyond a given distance (if transmission were to occur from an infected establishment) computed using the estimates (blue circles) and the lower and upper 95% confidence limits (error bars) for each kernel (and in the same order as) in Table 9. The thick black line indicates the median probability for all kernels. The black dotted lines indicate threshold probabilities of 0.05 and 0.01. The bottom panel shows the distances at which a threshold probability of transmission beyond that distance is reached when calculated using the estimates (circles) and lower and upper 95% confidence limits (error bars) for each kernel. The thick black line indicates the median distance for all kernels. The black dotted lines indicate distances of 3 and 10 km (i.e. the proposed radius of the protection and surveillance zones, respectively)
