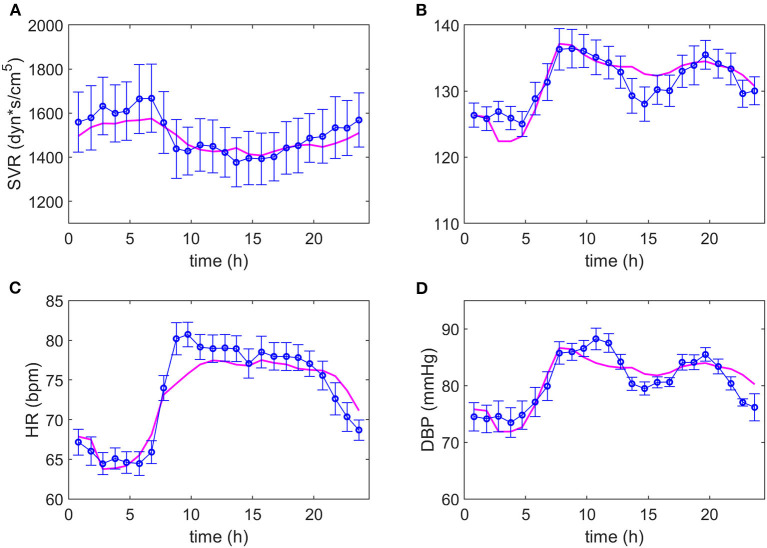
Figure 3.
Adjustment of the model to the experimental data of non-dipper subjects. The magenta line represents the values predicted by the model and the blue line and markers, the experimental data with their respective standard deviations. Dynamics of systemic vascular resistance (SVR), systolic blood pressure (SBP), heart rate (HR) and diastolic blood pressure (DBP) are presented in (A–D), respectively.

