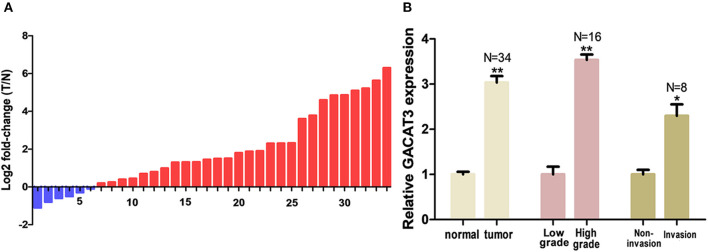
Figure 1.
GACAT3 was overexpressed in bladder cancer. Relative GACAT3 expression was detected using Real-Time qPCR. The relative GACAT3 expression value was set as the base value of 1 in each control group. N, number of study population in each group. (A) T represents tumor, N represents normal. The heights of the columns in the chart represent the log2-transformed fold changes (tumor/normal) in GACAT3 expression in 36 patients. (B) GACAT3 expression levels were higher in tumors than those in normal tissues (**p < 0.01). GACAT3 expression levels were higher in high grade cancers than those in low grade cancers (**p < 0.01). GACAT3 expression levels were higher in invasive cancers than those in non-invasive cancers (*p < 0.05).

