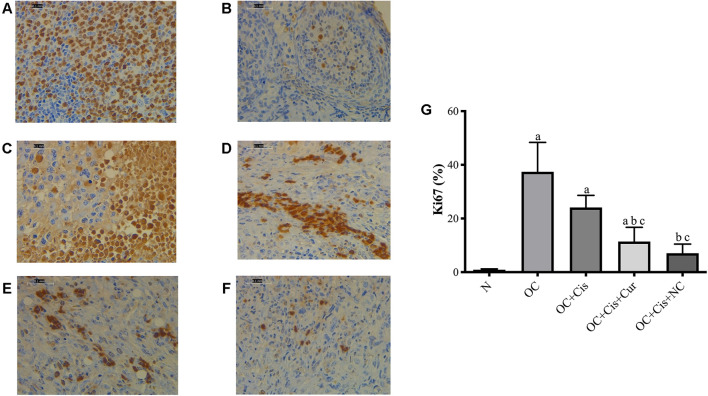
FIGURE 3.
Representative images on the Ki67 protein expressions in the rat ovaries and the result of quantification (A) Positive control (reactive tonsil) (B) Normal/sham group (C) ovarian cancer (D) ovarian cancer rats treated with cisplatin (E) ovarian cancer rats treated with cisplatin and curcumin; (F) ovarian cancer rats treated with cisplatin and nanocurcumin (G) The result of Ki67 protein expressions quantifications (calculated using ImageJ) (A)–(F) Magnification at ×400. (A) p value < 0.05 vs. N (sham); (B) p value < 0.05 vs. OC; (C) p value < 0.05 vs. OC + Cis.

