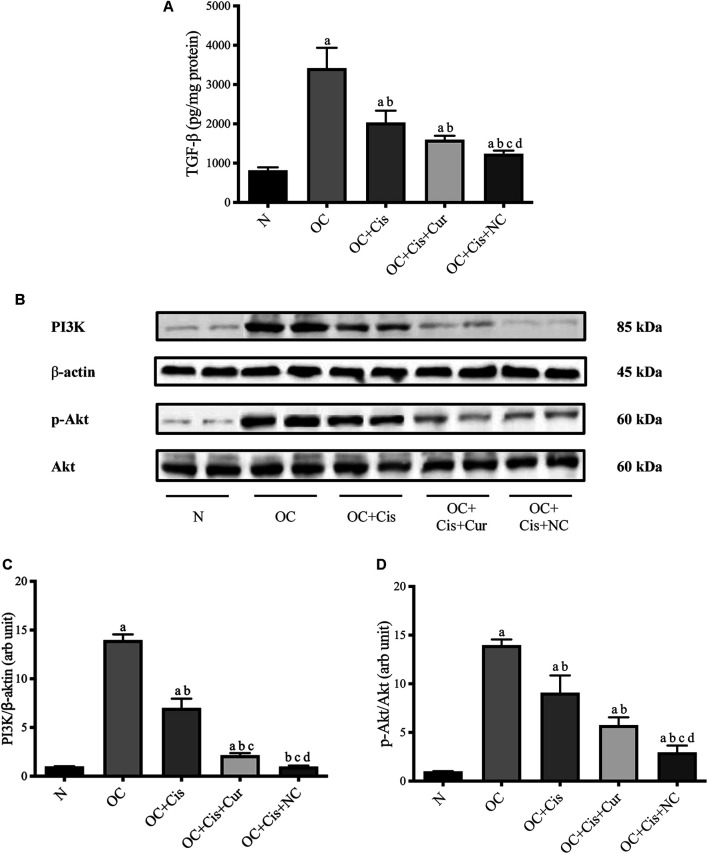
FIGURE 5.
Decreased TGF-β/PI3K/Akt in rat ovaries after treatment with cisplatin or cisplatin + curcumin or cisplatin + nanocurcumin (A) Decreased levels of active TGF-β (pg/mg protein) (B) Western blot analysis for PI3K (normalized to β-actin as control), and phospho (p)-Akt (normalized to Akt as control) (C) Downregulation of PI3K/β-actin expressions (D) Decreased p-Akt/Akt (arb unit). Full blot data are available in Supplementary Material. (A) p value < 0.05 vs. N (sham) group; (B) p value < 0.05 vs. OC; (C) p value < 0.05 vs. OC + Cis; (D) p value < 0.05 vs. OC + Cis + Cur.

