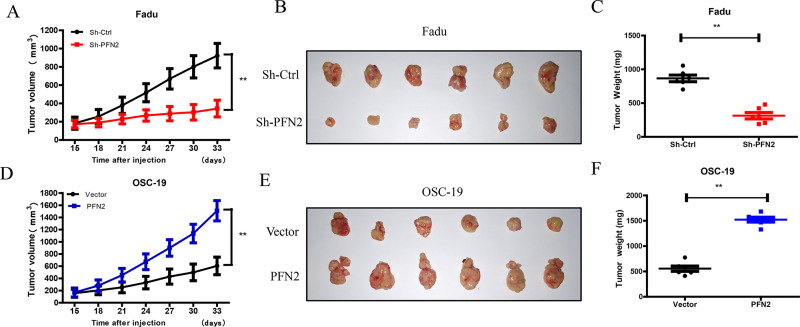
Figure 8.
Effects of PFN2 expression on tumor growth in vivo. Fadu cells with PFN2 knockdown and OSC-19 cells with PFN2 overexpression were subcutaneously injected to construct the xenograft tumor model, and tumor growth was monitored. Two weeks after transplantation, the length (L) and width (W) of the tumor were measured every 3 days with vernier calipers. (A, D) Tumor volume was calculated according to the formula: (L × W 2)/2, and the growth curves of xenografts in nude mouse were drawn. (B, E) Tumors isolated from mice 33 days after transplantation. (C, F) The tumor nodules were weighed after they were harvested. Data were expressed as mean ± SEM from six independent experiments, n = 6. **p < 0.01.

