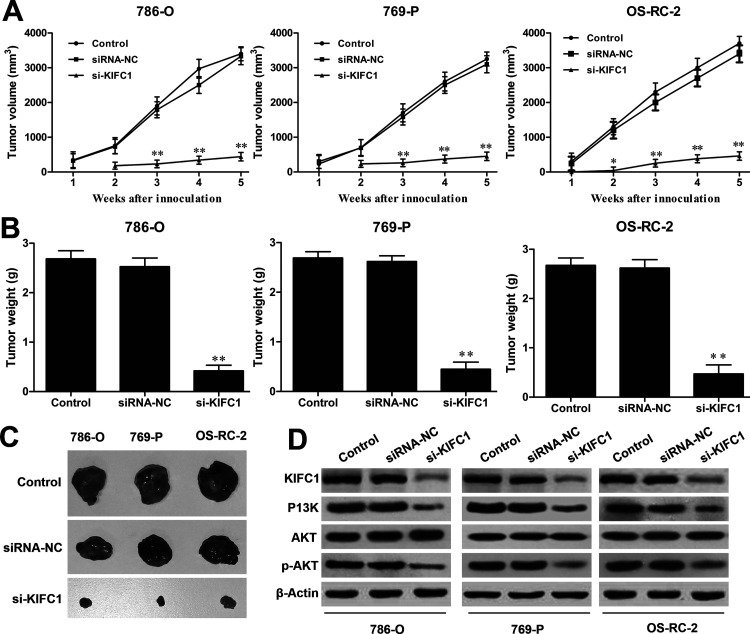
Figure 6.
Effect of KIFC1 knockdown on tumorigenesis in nude mice. (A) Time course of tumor volume was assessed by serial microcaliper measurements from the nude mice treated with 786-O, 769-P, and OS-RC-2 cells transfected with si-KIFC1 or siRNA-NC. Tumor weights (B) and representative tumor images (C) of xenografted tumors from each group were measured at 35 days after injection. (D) The expression levels of KIFC1, PI3K, p-AKT, and AKT were determined by Western blot assay. The experiments were triplicate repeats. Data shown as mean ± SD. *p < 0.05, **p < 0.01 compared to siRNA-NC.

