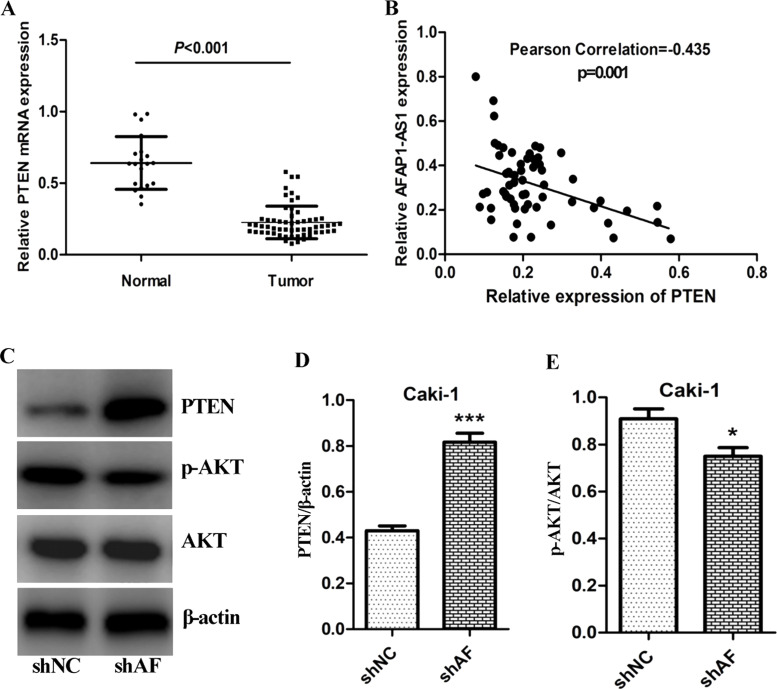
Figure 4.
Negative correlation of AFAP1-AS1 and PTEN. (A) The comparison of PTEN expression in ccRCC tissues (n = 60) with that of adjacent normal tissues (n = 20), the mRNA expression level of PTEN determined by qRT-PCR analysis. (B) The correlation of PTEN and AFAP1-AS1 was analyzed by Pearson test, and Pearson correlation r = −0.435, p < 0.001. (C, D, E) Effect of knockdown of AFAP1-AS1 on expression of PTEN and pAKT, and AKT was detected by immunoblot analysis. β-Actin was used as loading control, *p < 0.05; ***p < 0.001.

