
FIGURE 1.
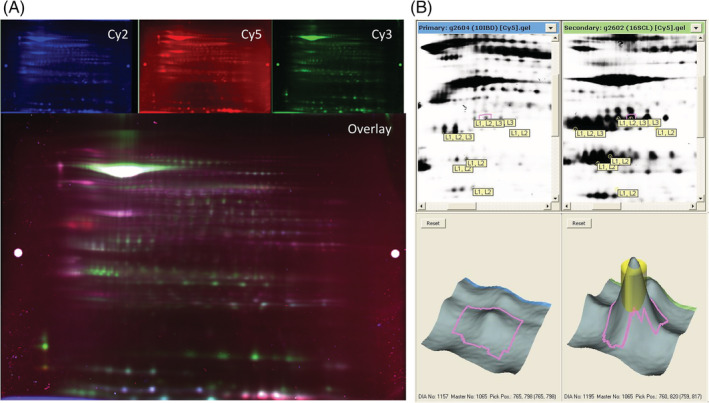
Representative examples of a 2‐dimensional difference in gel electrophoresis (2D‐DIGE) imaged using the ImageQuant software and analyzed by the DeCyder software. A, Representative fluorescent protein profiles of a gel containing protein samples extracted from the small intestinal mucosa of a cat with lymphoplasmacytic enteritis (LPE) labeled with Cy2 (top left), a cat with intestinal small cell lymphoma (SCL) labeled with Cy5 (top middle), a pooled internal control labeled with Cy3 (top right), and the overlay image (bottom) as seen in the ImageQuant software. B. Representative view of gel images uploaded into DeCyder software and analyzed by the Biological Variation Analysis module. Top: black and white images of gels containing protein samples from a cat with LPE (left) and SCL (right). Bottom: Enlarged region and 3‐D view of upregulated spot 1065 within the respective gels. The pink area demarcates the area analyzed by DeCyder for protein spot intensity. The yellow cylinder represents the area that can be picked during spot picking and analyzed by mass spectrometry for protein identification