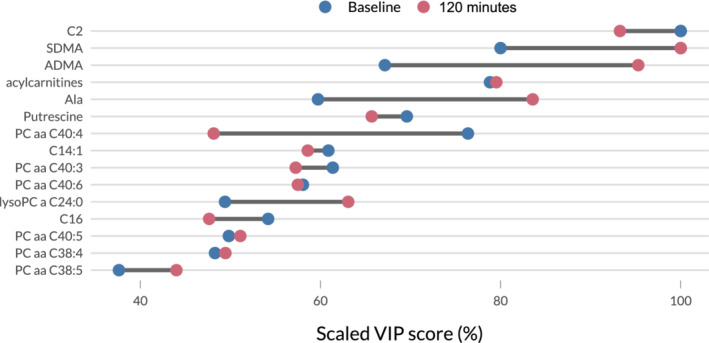
FIGURE 2.

Dumbbell plot of the scaled Variable Importance in Projection (VIP) scores of the top 10 metabolites from the baseline and 120 minutes partial least‐squares discriminant analysis (PLS‐DA) models. The scaling of the scores allows for a better comparability between models. As there is some overlap between the 10 metabolites in each model, the combination of both rankings results in the 15 metabolites displayed here. The dark segments between pairs of points represent the difference in relative importance of the metabolites. Large differences indicate that although the metabolite is very helpful in distinguishing horses with a high area under the insulin curve over time (AUCins) from horses with a low 1in‐ model, the difference between both groups regarding this metabolite is less striking at the other time point
