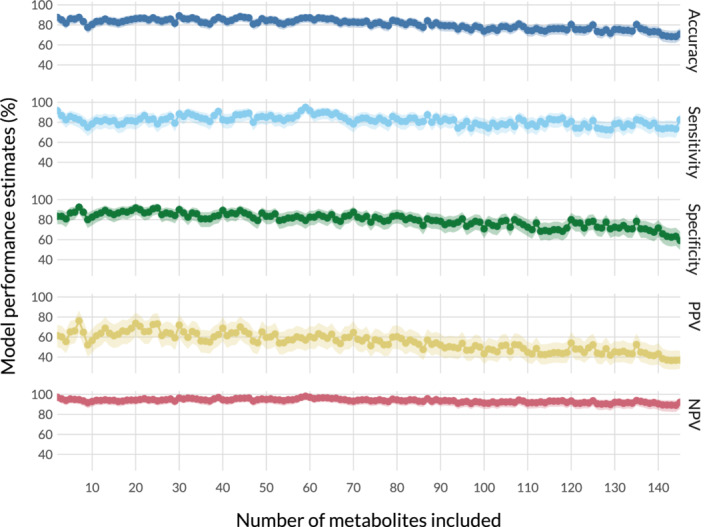
FIGURE 3.

Model performance estimates on the baseline samples obtained by bootstrap cross‐validation depending on the number of metabolites included. Positive Predictive Value (PPV) and Negative Predictive Value (NPV) were obtained using abovementioned formulas and the mean of previously reported prevalence of hyperinsulinemia. 28 , 29 , 30 The 95% confidence interval is shown as a shaded area behind each estimate. Overall, best model performance is reached with the top 7 and top 20 metabolites as determined by the baseline partial least‐squares discriminant analysis (PLS‐DA) model including all metabolites
