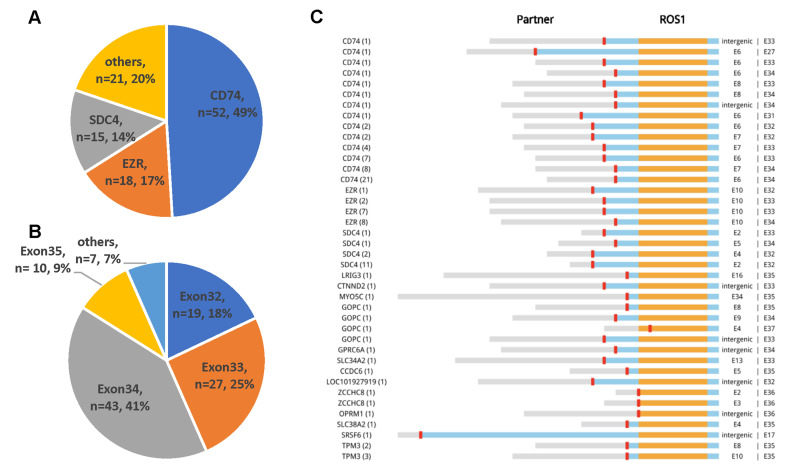
Figure 2.
Overall landscape of ROS1 fusion partners detected by capture-based next-generation sequencing (n = 106). (A) Frequency of ROS1 fusions partners. (B) Distribution of ROS1 breakpoints. (C) Schematic representations of ROS1 fusion partners. Orange, tyrosine kinase domain; blue, transmembrane domain; red, coiled-coil domain.

