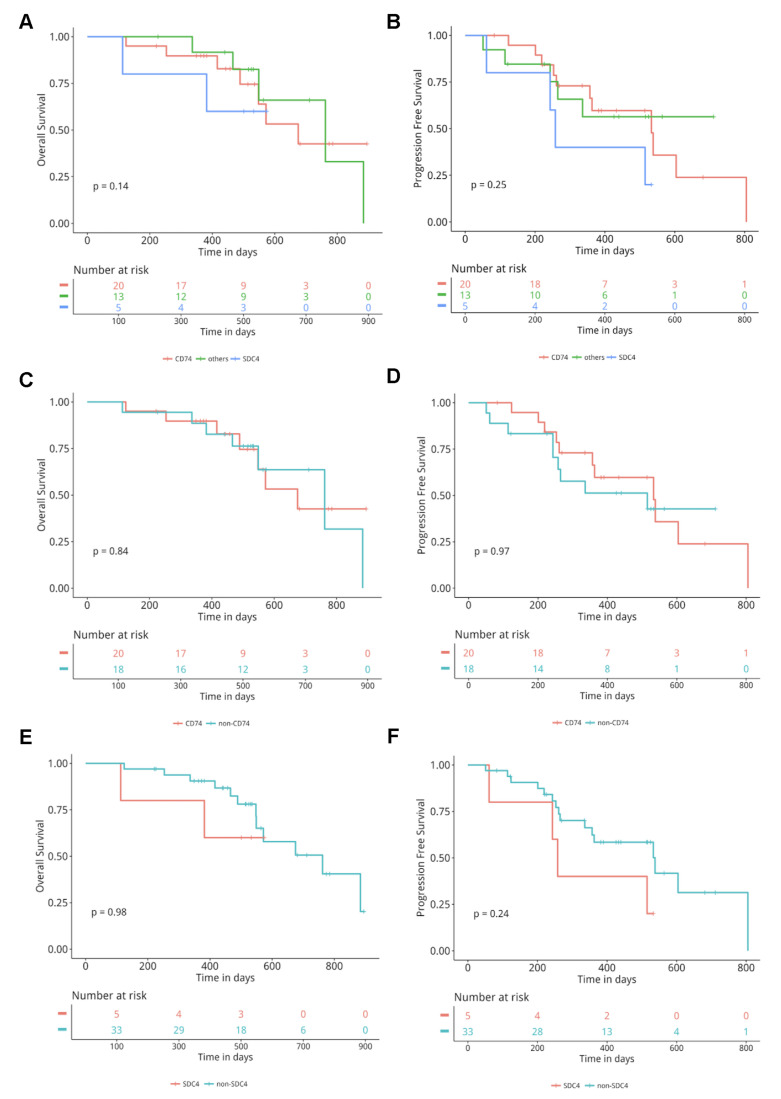
Figure 3.
Comparison of overall survival (OS) and progression-free survival (PFS) among different ROS1 fusion pattern-positive patients treated with crizotinib. Kaplan–Meier curves for OS (A) and PFS (B) in the cluster of differentiation 74 (CD74)-ROS1, SDC4-ROS1, and others groups. Kaplan–Meier curves for OS (C) and PFS (D) in the CD74-ROS1 versus the non-CD74-ROS1 group. Kaplan–Meier curves for OS (E) and PFS (F) in the SDC4-ROS1 versus the non-SDC4-ROS1 group.

