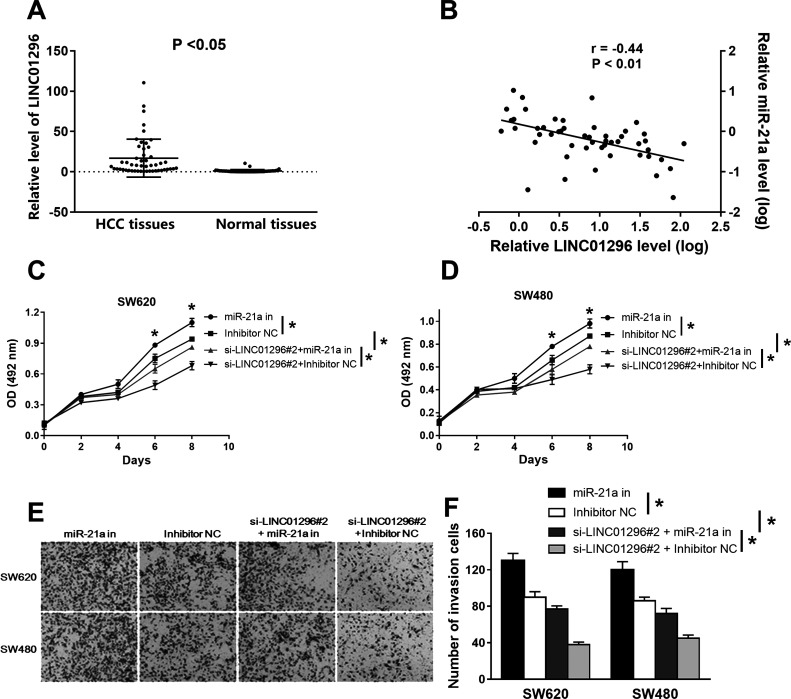
Figure 3.
The relationship between miR-21a and LINC01296. (A) The expression level of LINC01296 was increased in CC tissues, while the miR-21a expression level was decreased in the same tumor tissues. (B) The result of the Spearman correlation analysis showed that there is a negative relationship between the expression of LINC01296 and miR-21a. (C, D) The results of the MTS assay showed that miR-21a inhibitor eliminated the effects of si-LINC01296#2 in reducing cell vitality. (E, F) The cotransfection of miR-21a inhibitors and si-LINC01296#2 eliminated the inhibitory effect of si-LINC01296#1 on the invasion of CC cells. *p < 0.05.

