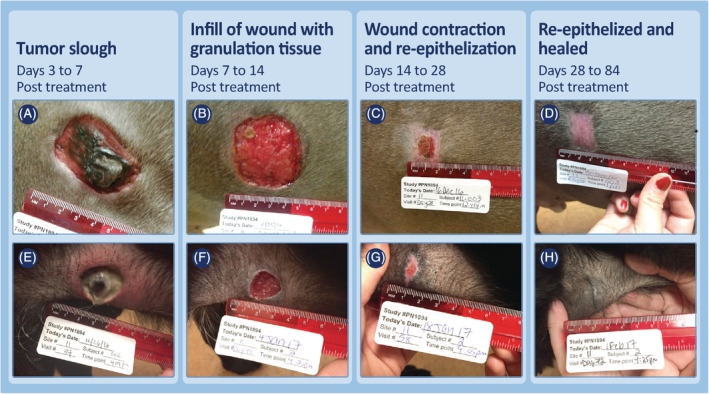
FIGURE 4.

Examples of the progression of wound healing after slough of MCTs on the body (which include those on the head, trunk, and in perineal locations) that had received a single treatment with TT. Case 11‐003 (A‐D) treated in phase 1 of the study had a 1.1 cm3 MCT at time of treatment and a maximal wound of 8.2 cm2 after tumor slough. Case 11‐002 (E‐H) treated in phase 2 of the study had a 0.4 cm3 MCT at time of treatment and a maximal wound of 7.4 cm2 after tumor slough. MCT, mast cell tumor; TT, tigilanol tiglate
