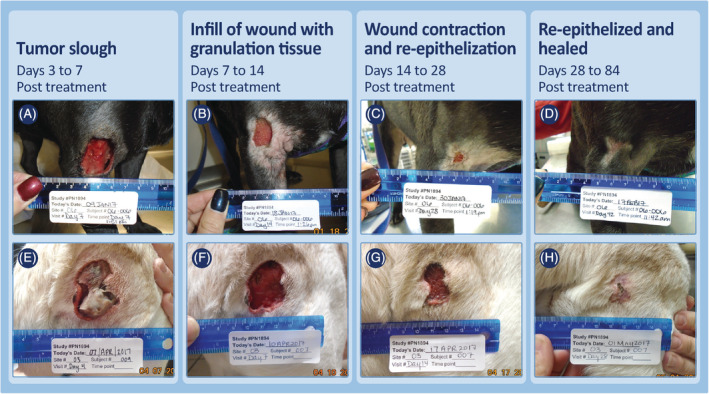
FIGURE 5.

Examples of the progression of wound healing after slough of MCTs on upper limbs (above the elbow and hock) that had received a single treatment with TT. Case 06‐006 (A‐D) was treated in phase 1 of the study had a 2.8 cm3 MCT at time of treatment and a maximal wound at time of tumor slough of 8.8 cm2. Case 03‐007 (E‐H, note figure E on day 4 post‐treatment has incorrect subject number written) also was treated in phase 1 of the study and had a 3.8 cm3 MCT at time of treatment. A maximal wound of 10.3 cm2 was recorded after tumor slough. MCT, mast cell tumor; TT, tigilanol tiglate
