FIGURE 5.

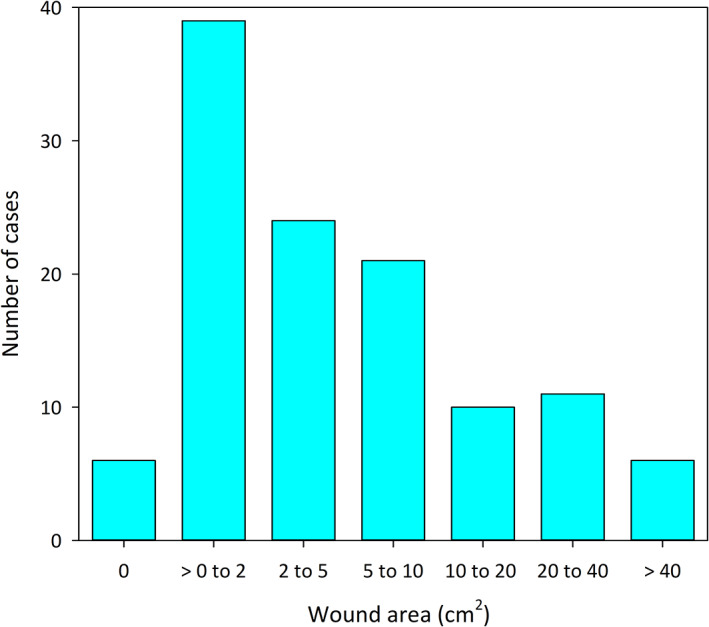
The distribution of maximum wound areas that developed after a single treatment with tigilanol tiglate arranged by number of cases in each of 7 wound size classes

The distribution of maximum wound areas that developed after a single treatment with tigilanol tiglate arranged by number of cases in each of 7 wound size classes