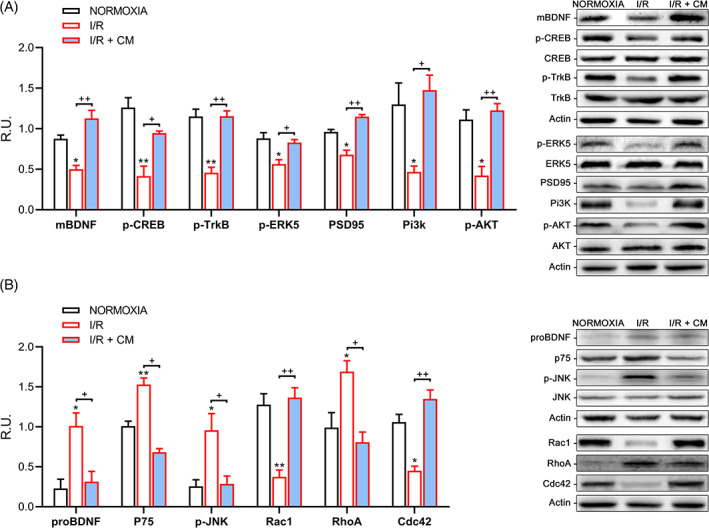
FIGURE 2.

A, Western blotting and relative densitometric analysis for the neuroprotective pathway. Results are mean ± SE of 3 experiments (n = 3). *P < .05, **P < .005 vs Normoxia; +P < .05, ++P < .005 vs I/R. Representative WB images are reported. B, Western blotting and relative densitometric analysis for the neuronal death pathway and for Rho‐family GTPases. Results are mean ± SE of 3 experiments (n = 3). *P < .05, **P < .005 vs Normoxia; +P < .05, ++P < .005 vs I/R. Representative WB images are reported. Phosphorylated proteins are normalized upon their respective total protein
