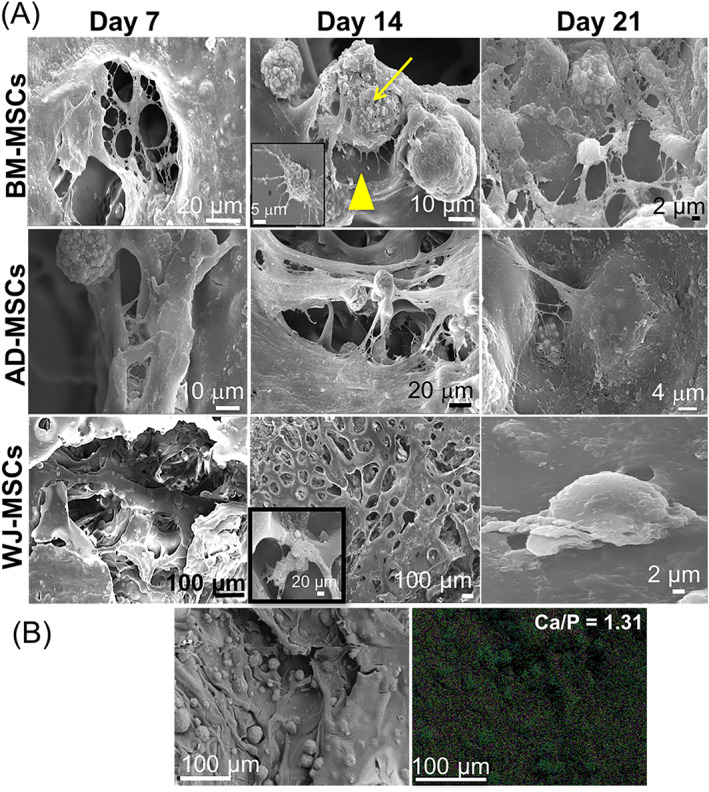
FIGURE 3.

A, SEM micrographs of the three tissue‐specific hMSCs cultured over CHT/HA/PCL over the 21‐day culture period. The yellow arrowhead in BM‐MSC‐laden composite at day 14 points toward the cellular protrusions arising from the transition of osteoblast to osteocyte phenotype. B. EDX analysis showing the elemental map to determine the overall composition of the biomineralized surface on the BM‐MSC‐laden composites. The area selected for EDX analysis is represented by the adjacent (left) SEM micrograph. CHT, chitosan; BM‐MSC, bone marrow‐derived MSCs; EDX, energy‐dispersive X‐ray; HA, hydroxyapatite; hMSCs, human MSCs; MSCs, mesenchymal stem cells; PCL, polycaprolactone; SEM, scanning electron microscopy
