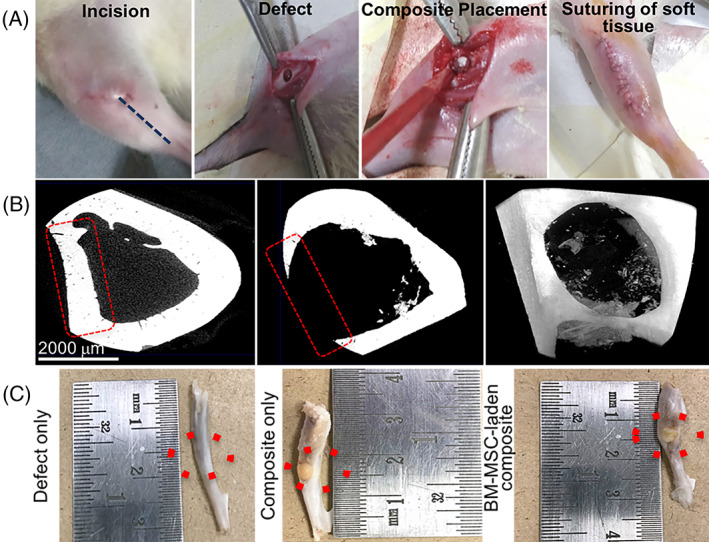
FIGURE 5.

A, Surgical scheme for developing rat tibial defect model. B, Micro‐CT images depict the region of interest (red dotted lines) with the defect created at day 0 in trans‐axial slice and frontal frame, respectively. Gross examination of ex vivo samples of rat tibiae harvested 6 weeks post surgery. The composite appears to be well integrated inside the bone defect. Control or defect‐only tibiae show a slight dent on the external surface. Red dotted circles indicate the region of interest. Micro‐CT, microcomputed tomography
