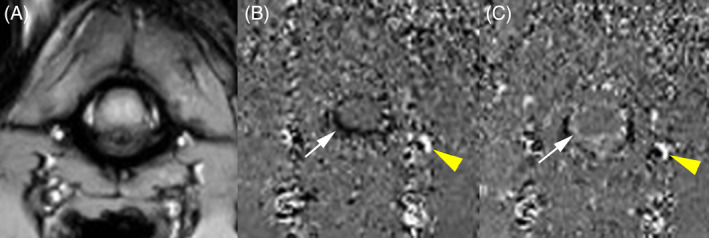
FIGURE 2.

Magnitude (A) and phase images (B,C) at the level of atlantoaxial junction. On the phase image, every pixel carries velocity information. Cerebrospinal fuid (CSF) flow in rostrocaudal direction is displayed as negative velocity values and appears black (B, yellow arrow head). CSF flow in caudorostral direction is displayed as positive velocity values and appears white (C, yellow arrow head). Note the aliasing displayed as black and white pixels within the vertebral vessels (B,C: black arrow head)
