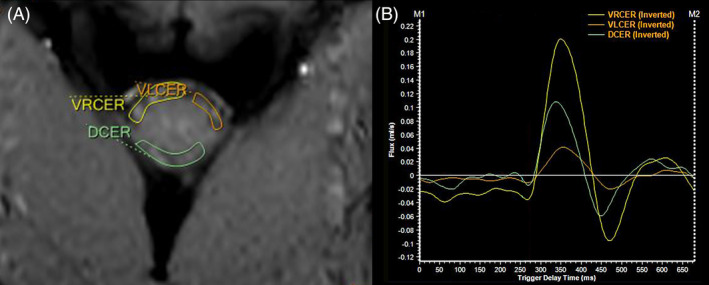
FIGURE 3.

Transverse magnitude image close to the C2/C3 (dorsal is at the lower edge of the image) (A) with regions of interest (ROIs) drawn within the ventral (yellow and orange) and dorsal (green) subarachnoid space. Time velocity curves in B represent the flow (in mL/s over time in ms) of the corresponding ROI showing a biphasic flow pattern
