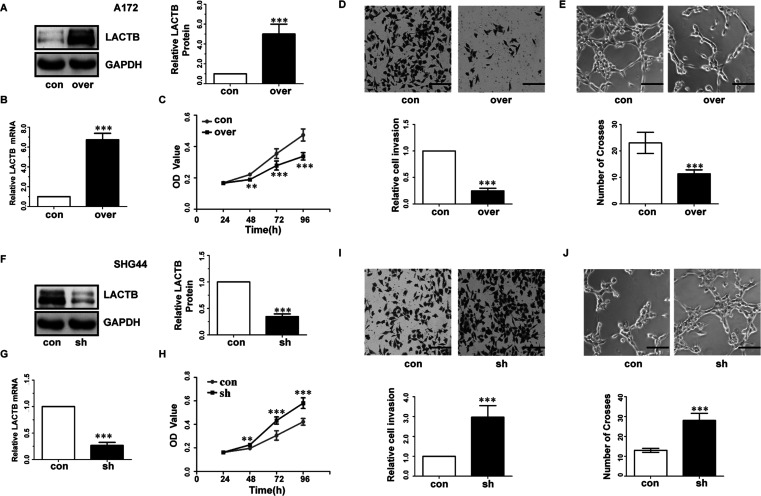
Figure 2.
LACTB inhibited proliferation invasion and angiogenesis of glioma cells. (A, B, F, G) RT-qPCR and Western blot were conducted to determine the mRNA levels and protein of LACTB in A172 and SHG44 cells. (C, H) CCK-8 assay tested cell proliferation in A172 and SHG44 cells. (D, I) Representative fields of A172 and SHG44 invasive cells (scale bar: 100 μm, 200×) (up), average number of invasive cells per field from three independent experiments (down). con, transfected with empty vectors or control shRNA; over, transfected with LACTB vectors; sh, transfected with LACTB shRNA. (E, J) Representative fields of tube formation of HUVECs (scale bars: 100 μm, 200×) (up) and number of crosses of tube formation by HUVECs. Data are based on at least three independent experiments and shown as the means ± standard deviation (SD). **p < 0.01, ***p < 0.001, compared with con.

