Fig. 1.
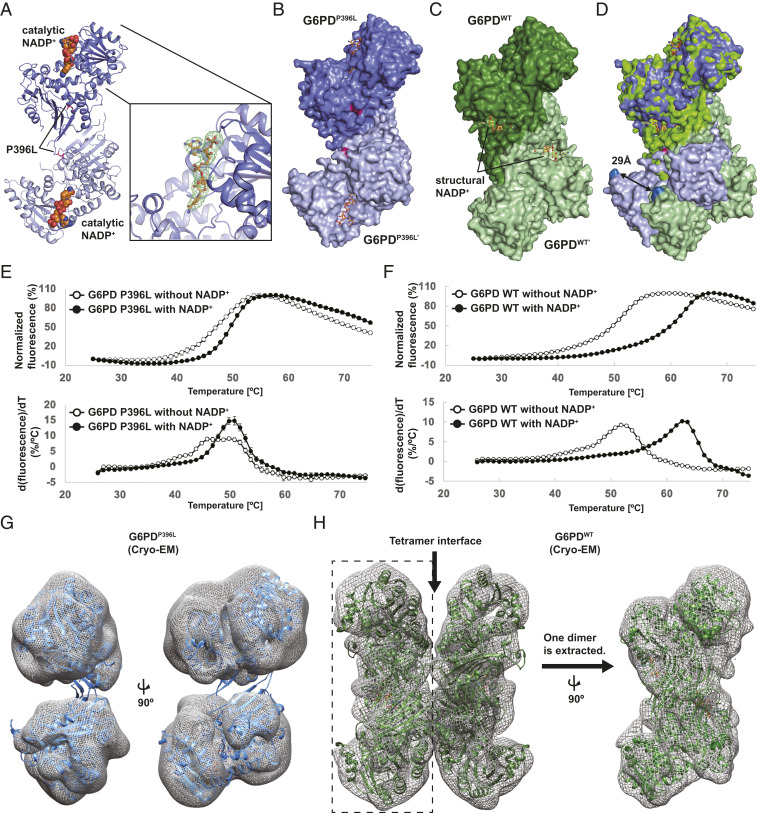
Overall structure of the class I mutant, G6PDP396L. (A) Overall structure of the dimer G6PDP396L. Two G6PD molecules and the catalytic NADP+ are shown in blue, light blue, and orange, respectively. The catalytic NADP+-binding site is shown in close-up view on the Right. The Fo-DFc map for the catalytic NADP+ is contoured at 3.0σ level. (B) Space filling model of the dimer G6PDP396L. (C) Space filling model of the dimer G6PDWT. (D) Superimposition of the dimer G6PDP396L and G6PDWT. Distance between Cα-carbon atoms of E93 residues in the G6PDP396L and G6PDWT structures are shown. (E and F) The thermal denaturation curves of the G6PDP396L and G6PDWT with or without NADP+ (Top). The error bars indicate the SDs (n = 4). Bottom shows the derivative values of the thermal denaturation curves on the Top. (G) Crystal structure of G6PDP396L dimer is superimposed with the cryo-EM map of G6PDP396L. The G6PDP396L dimer on the Left is rotated by 90° on the Right. (H) Crystal structure of the G6PDWT tetramer (PDB ID: 6E08) is superimposed with the cryo-EM map of G6PDWT. The cryo-EM map of the Left half on the Left (enclosed with a dashed rectangle) is extracted and rotated by 90°. The crystal structure of the G6PDWT dimer (PDB ID: 6E08) is superimposed with the cryo-EM map on the Right.

