Fig. 4.
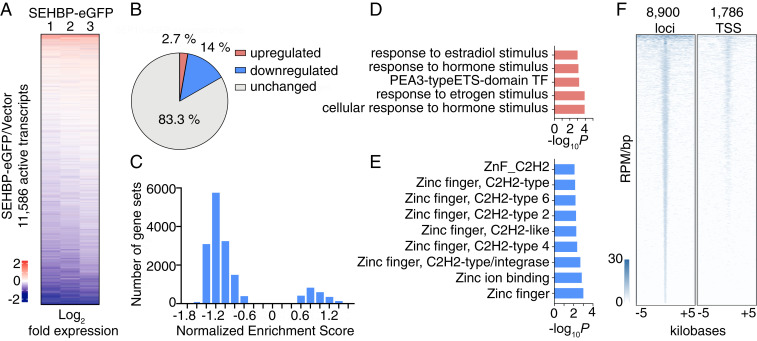
SEHBP modulates transcription at distinct loci. (A) Rank-ordered heat map depicting the log2-fold change of mRNA levels in response to SEHBP overexpression relative to a vector control in RNA-seq experiments using HEK293T cells (three biological replicates). (B) Pie chart depicting the percentage of active transcripts significantly changed by SEHBP overexpression (P < 0.05). (C) Histogram comparing the normalized enrichment scores of all MSigDB gene sets using GSEA of RNA-seq data in response to SEHBP overexpression. Plots depicting the P values of representative up-regulated (D) and down-regulated (E) gene sets from RNA-seq analysis of HEK293T cells expressing SEHBP. (F) Rank-ordered heat map of ChIP-seq derived reads of SEHBP-based enrichment at 8,900 distinct loci (Left) and 1,786 TSSs (Right).

