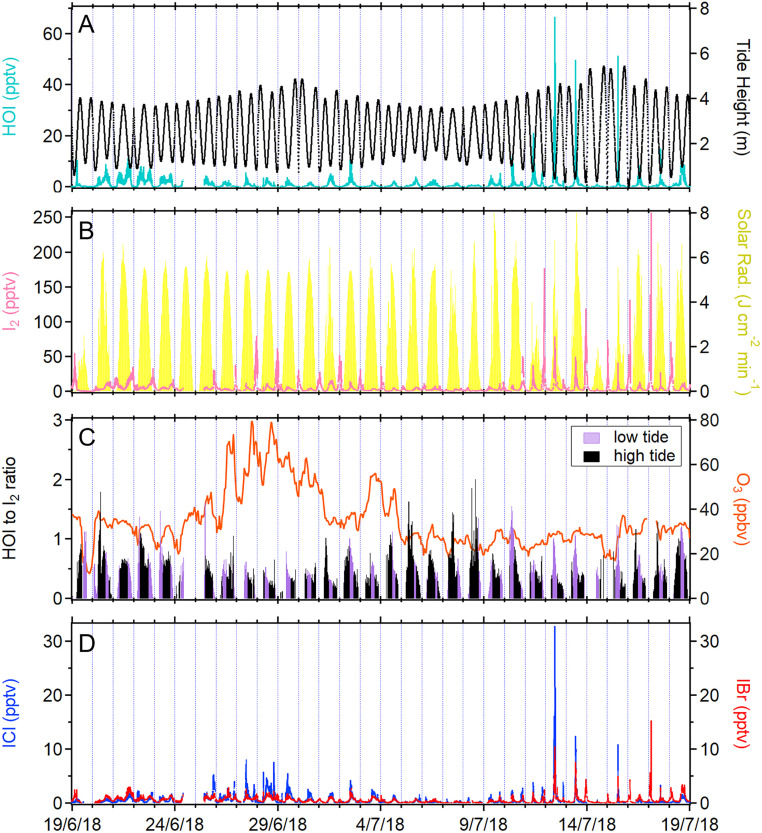
Fig. 1.
Time series of (A) HOI and the tidal heights and (B) I2 and solar radiation at Mace Head Observatory from June 19 to July 19, 2018 (1-min average data). (C) The ratio of HOI to I2 mixing ratios (5-min average) in relation to the O3 concentration. The I2 and HOI mixing ratios below the detection and quantification were omitted. The ozone data are 1-h average. (D) Time series of ICl and IBr observed during the campaign (1-min average). The time presented in this study is in Coordinated Universal Time (+1 in local time).

