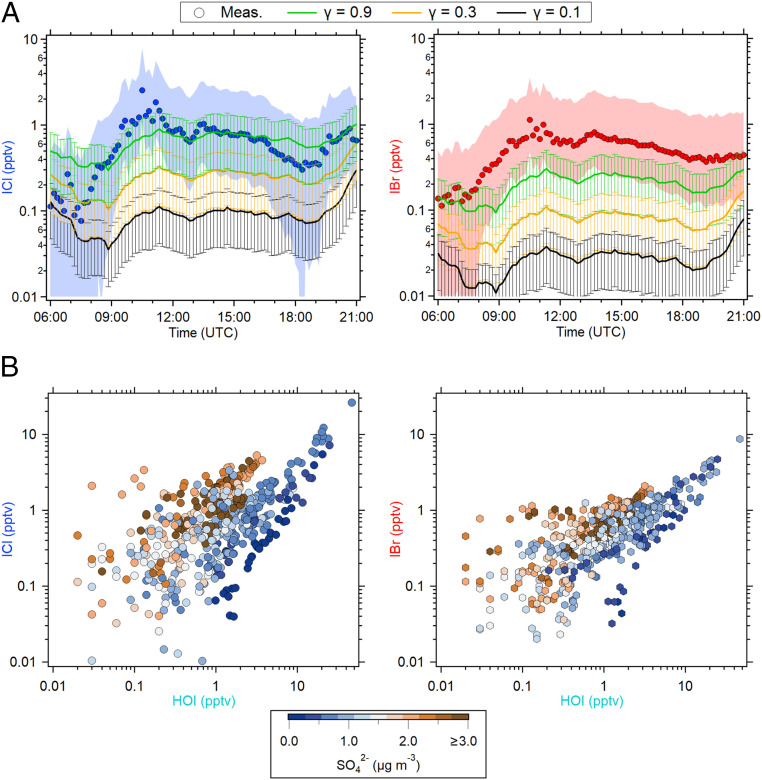
Fig. 3.
(A) Diel pattern of the observed versus modeled ICl and IBr during daytime. The solid circle represents the average value of ambient observation of ICl (blue) and IBr (red). The shaded area is the uncertainty for ICl and IBr measurements (±200% + LOD). Error bar shows the estimated uncertainty for the simulations (±63%), calculated using the propagation of uncertainties of HOI measurement and aerosol surface area. The data from June 26 to July 14 of 2018 were used in this analysis due to the availability of continuous data for use in THAMO modeling. (B) The three-way relationships of aerosol-sulfate concentration with ICl and IBr, together with HOI. The aerosol-sulfate concentration was measured by the aerosol mass spectrometer which has an inlet with particle cutoff of 1 μm in size (refer to SI Appendix, Table S4). Note that only data at daytime low tides (tidal height < 2 m and solar radiation > 0 J · cm−2 · min−1) from June 26 to July 14 of 2018 were used.

