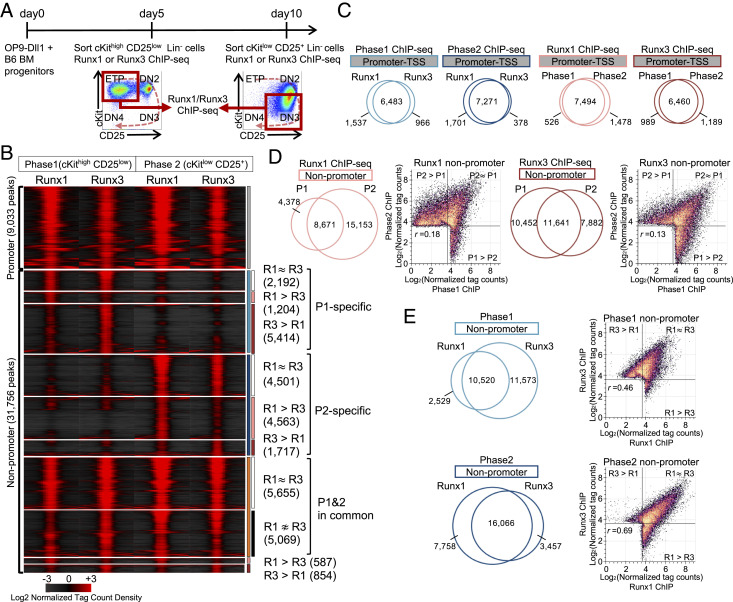
Fig. 2.
Runx1 and Runx3 interact with shared genomic sites that shift at different developmental stages. (A) Progenitor cells from normal bone marrow (BM) were cultured with OP9-Dll1 stromal cells for 5 d (Phase1) or for 10 d (Phase2); then, pro-T cells in Phase1 (cKithigh CD25low) or Phase2 (cKitlow CD25+) were fluorescence-activated cell-sorted for chromatin immunoprecipitation with sequencing (ChIP-seq) as described in Materials and Methods. Experiment schematic and gating strategy are shown. (B) Tag count distributions for Runx1 and Runx3 in Phase1 and Phase2 stages are represented by peak-centered heat map. P1: Phase1; P2: Phase2; R1: Runx1; R3, Runx3. (C–E) Area-proportional Venn diagrams illustrate the peak overlaps of Runx1 and Runx3 ChIP-seq peaks in Phase1 and Phase2, with numbers of peaks in each category. Scatterplots compare log2 normalized tag counts per 10 million tags for peaks in indicated categories with Pearson correlation r. (C) Promoter region peaks (TSS: transcription start site); (D) nonpromoter region peak comparison for Runx1 and Runx3; and (E) nonpromoter region comparison for Phase1 and Phase2. Data are based on ChIP-seq peaks scored as reproducible in two replicate samples (B–E).

